Figure 1.
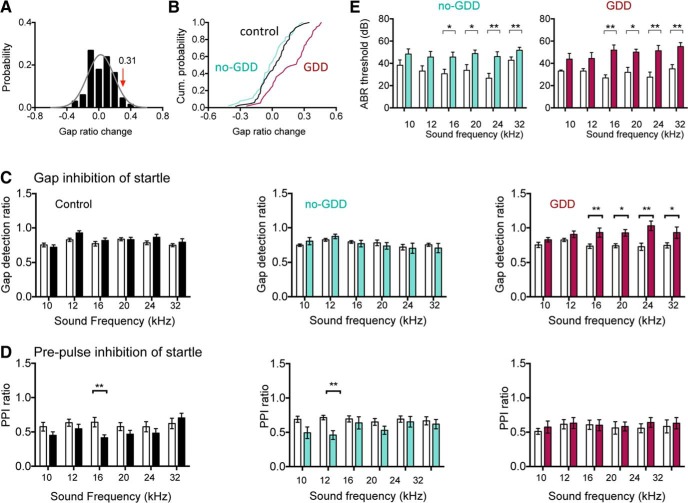
Effects of noise exposure on gap detection and PPI. A, Distribution of changes in gap startle ratios (response to startle stimulus with gap present divided by response to startle stimulus alone) over a 1 week period in control mice. Data fitted with normal distribution (gray curve, μ = 0.02, σ = 0.145, n = 67 sound frequencies). Gap ratio changes >2σ above the distribution mean (0.31) are considered a GDD. B, Cumulative probability distribution of gap ratio changes after noise exposure. C, Summary graphs of gap startle ratios before (open bars) and 7 d after noise exposure (closed bars). Gap detection ratios remain stable in no-GDD mice, but are increased for higher sound frequencies in GDD mice. See Figure 2 source data 1 for raw data and exact p values. D, Summary graphs of PPI startle ratio before and after noise exposure. Error bars indicate SEM. Asterisks indicate statistical significance. *p < 0.05, **p < 0.01. E, Summary graphs of ABR thresholds before and 7 d after noise exposure in vgat-ires-cre-dT mice. Thresholds for higher sound frequencies were elevated after noise exposure in both no-GDD and GDD mice. Error bars indicate SEM. *p < 0.05, **p < 0.01. A–E are from vgat-ires-cre-dT-loxP mice; similar results were obtained from vglut2-cre-dT-loxP mice (data not shown).

