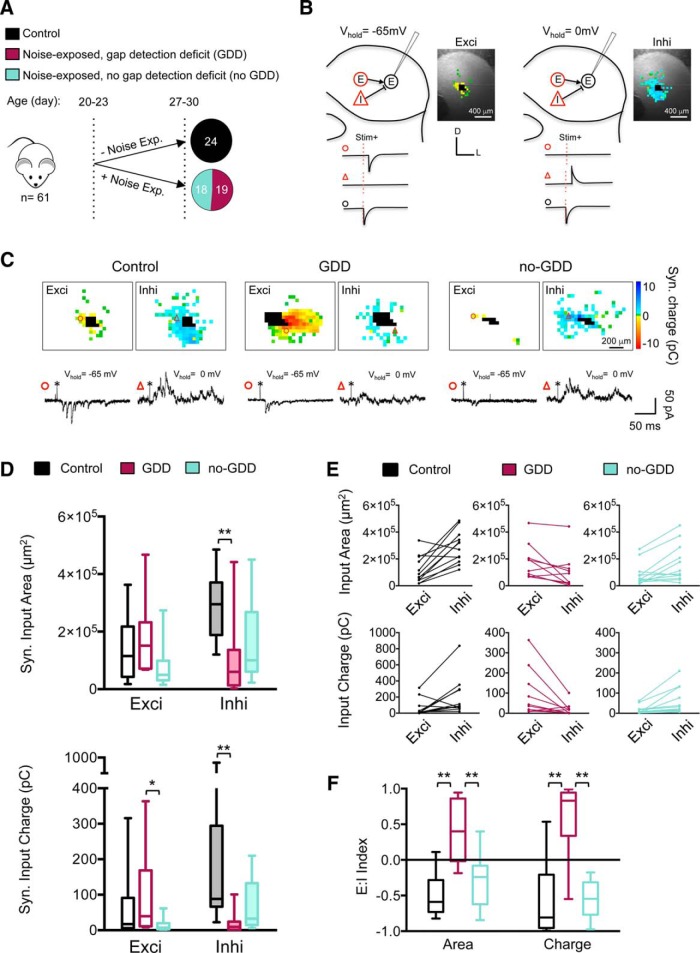
Figure 2.
Noise-induced reorganization of synaptic input maps onto glutamatergic IC neurons. A, Mice were noise exposed at P20–P23 and tested 7 d later for GDDs. Nineteen of 37 NE mice (51%) developed a GDD. B, Schematic of mapping excitatory (red E) and inhibitory (red I) synaptic inputs to glutamatergic (vglut2+) neurons (black encircled E). Excitatory and inhibitory synaptic input maps are obtained at a membrane holding voltage (Vm) of −65 mV (left) and 0 mV (right), respectively. Example maps are overlaid over a photograph of the corresponding IC slice. C, Examples of input maps from control, NE with GDD, and noise exposed without GDD (no-GDD) mice. Traces illustrate excitatory (¢) and inhibitory (Δ) synaptic responses to glutamate uncaging (*) at the locations indicated by symbols. Uncaging sites that elicited direct responses in the recorded neuron are marked as black. Examples maps and recordings traces are from single stimulation iterations. D, Noise trauma decreased inhibitory input area (top) and total inhibitory charge (bottom) in GDD mice, but not in no-GDD mice (median inhi area: control = 2.95 × 105 μm2, n = 12 neurons, n = 6 animals, GDD = 0.60 × 105 μm2, n = 10 neurons, n = 6 animals, no-GDD = 1.0 × 105 μm2, n = 12 neurons, n = 7 animals, F(2,31) = 6.13, p = 0.006, one-way ANOVA; median inhi charge: control = 88.3 pC, n = 12 neurons, n = 6 animals, GDD = 9.6 pC, n = 10 neurons, n = 6 animals, no-GDD = 32.6, n = 11 neurons, n = 7 animals, H = 14.13, p = 0.0009, Kruskal–Wallis test). Total excitatory charge (bottom) was decreased in no-GDD mice compared with GDD mice (median exci charge: control = 17.3 pC, n = 14 neurons, n = 6 animals, GDD = 39.4 pC, n = 10 neurons, n = 6 animals, no-GDD = 7.1 pC, n = 12 neurons, n = 7 animals, H = 6.43, p = 0.04, Kruskal–Wallis test). Data are shown as box-and-whisker plots; midline depicts median, box encompasses interquartile range and error bars represent total range. E, Excitatory and inhibitory synaptic inputs for individual neuron. Lines connect data from individual neurons. F, Mean of E:I indices of individual neurons for input area (left) and input charge (right; median E:IArea: control = −0.59, n = 12 neurons, n = 6 animals, GDD = 0.40, n = 10 neurons, n = 6 animals, no-GDD = −0.24, n = 12 neurons, n = 7 animals, F(2,31) = 17.72, p < 0.0001, one-way ANOVA; median E:ICharge: control = −0.81, n = 12 neurons, n = 6 animals, GDD = 0.83, n = 10 neurons, n = 6 animals, no-GDD = −0.55, n = 11 neurons, n = 7 animals, F(2,30) = 21.62, p < 0.0001, one-way ANOVA). *p < 0.05, **p < 0.01 in post hoc, pairwise assessments corrected for multiple comparisons.

