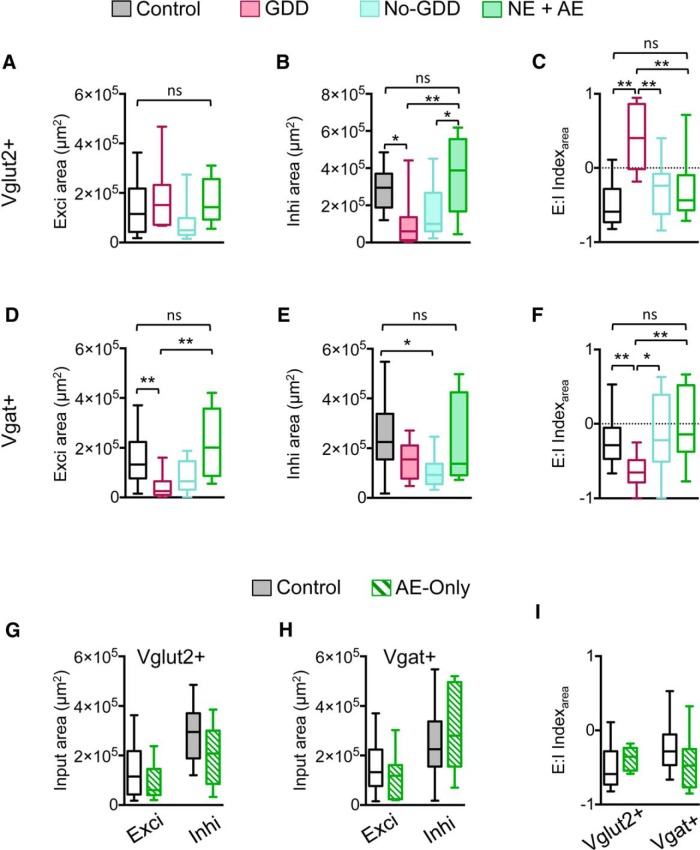
Figure 8.
AE with pulsed white noise inhibits noise-trauma-induced circuit reorganization. A, Excitatory input maps of glutamatergic neurons (Vglut2+) in control, GDD, no-GDD (same data as in Figs. 2, 5), and NE-AE mice (median exci area: control = 1.15 × 105 μm2, n = 15 neurons, n = 6 animals, NE-AE = 1.43 × 105 μm2, n = 9 neurons, n = 4 animals, F(3,42) = 1.78, p = 0.180, one-way ANOVA: 95% CI of difference between control vs NE-AE = −1.45–0.92 × 105 μm2, corrected pairwise comparison after one-way ANOVA). B, Same as A but for inhibitory input maps (median inhi area: control = 2.95 × 105 μm2, n = 12 neurons, n = 6 animals, NE-AE = 3.88 × 105 μm2, n = 9 neurons, n = 4 animals, F(3,39) = 6.008, p = 0.0018, one-way ANOVA: 95% CI of difference between control vs NE-AE = −2.44–1.11 × 105 μm2, corrected pairwise comparison after one-way ANOVA). C, E:I indices of glutamatergic neurons. The E:I indices from NE-AE animals are not significantly different from those of control animals (median E:I index, control = −0.59, n = 12 neurons, n = 6 animals, NE-AE = −0.44, n = 9 neurons, n = 4 animals, F(3,39) = 11.18, p < 0.0001, one-way ANOVA: 95% CI of difference between control vs NE-AE = −0.65–0.24, corrected pairwise comparison after one-way ANOVA). D–F, Same as in A–C but for type 1 GABAergic neurons (vgat+). D, Excitatory input maps (median exci area: control = 1.33 × 105 μm2, n = 20 neurons, n = 10 animals, NE-AE = 2.01 × 105 μm2, n = 8 neurons, n = 4 animals, H = 17.50, p = 0.0006, Kruskal–Wallis test, mean rank difference for control vs NE-AE = −5.36, p > 0.05, Dunn's test after Kruskal–Wallis test). E, Inhibitory input maps (median inhi area, control = 2.25 × 105 μm2, n = 21 neurons, n = 10 animals, NE-AE = 1.38 × 105 μm2, n = 9 neurons, n = 4 animals, H = 10.60, p = 0.014, Kruskal–Wallis test, mean rank difference for control vs NE-AE = 4.93, p > 0.05, Dunn's test after Kruskal–Wallis test). F, E:I indices (median E:I index, control = −0.28, n = 20 neurons, n = 10 animals, NE-AE = −0.14, n = 8 neurons, n = 4 animals, H = 15.17, p = 0.0017, Kruskal–Wallis test, mean rank difference of between control vs NE-AE = −5.50, p > 0.05, Dunn's test after Kruskal–Wallis test). G, AE applied to animals without noise trauma had no effect on excitatory or inhibitory input maps of glutamatergic neurons (vglut2+; exci area: control, n = 15 neurons, n = 6 animals, AE-only, n = 7 neurons, n = 4 animals, t(20) = 0.850, p = 0.41, two-tailed Student's t test: inhi area: control, n = 12 neurons, n = 6 animals, AE-only, n = 7 neurons, n = 4 animals, t(17) = p = 0.12, two-tailed Student's t test). H, Same as G but for type 1 GABAergic neurons (vgat+; exci area: control, n = 20 neurons, n = 10 animals, AE-alone, n = 9 neurons, n = 3 animals, t(27) = 0.99, p = 0.33, two-tailed Student's t test; inhi area: control, n = 21 neurons, n = 10 animals, AE-alone, n = 9 neurons, n = 3 animals, t(28) = 1.07, p = 0.29, two-tailed Student's t test). I, AE in nontraumatized animals did not change E:I indices for glutamatergic or for type 1 GABAergic neurons (Vglut2+ neurons: control, n = 12 neurons, n = 6 animals, AE-only, n = 7 neurons, n = 4 animals, t(17) = 1.08, p = 0.30, two-tailed Student's t test: Vgat+ neurons: control, n = 20 neurons, n = 10 animals, AE-only, n = 9 neurons, n = 3 animals, t(27) = 1.75, p = 0.09, two-tailed Student's t test). Data are shown as box-and-whisker plots. *p < 0.05, **p < 0.01.

