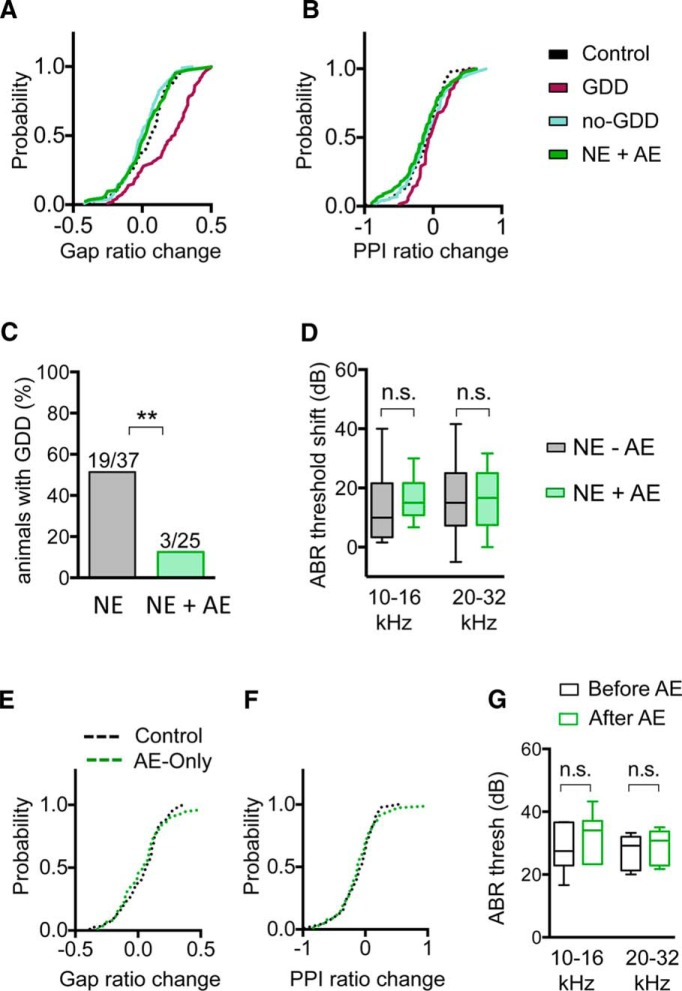
Figure 9.
AE prevents the development of GDDs. A, AE prevented the noise-induced increase in gap detection ratios observed in GDD mice (gap ratio change: control = 0.03 ± 0.02, n = 89 sound frequencies, GDD = 0.18 ± 0.02, n = 93 sound frequencies, no-GDD = 0.00 ± 0.01, n = 110 sound frequencies, NE-AE = 0.02 ± 0.02, n = 84 sound frequencies, p < 0.0001, Kruskal–Wallis test). B, PPI of the startle response was not significantly different between groups (PPI ratio change, control = −0.12 ± 0.03, n = 90 sound frequencies; GDD = 0.00 ± 0.03, n = 65 sound frequencies, no-GDD = −0.10 ± 0.04, n = 100 sound frequencies, NE-AE = −0.15 ± 0.04, n = 89 sound frequencies). C, Percentage of NE animals that developed GDDs (black) was decreased by AE (green; NE without AE, n = 37 animals, NE with AE, n = 25, p = 0.0025, two-tailed Fisher's exact test). D, AE did not affect noise-induced ABR threshold shifts at low or high frequencies (10–16 kHz: NE = 13.6 ± 2.8 dB, n = 17 animals, NE+AE = 16.2 ± 2.0 dB, n = 13 animals, t(28) = 0.73, p = 0.47, two-tailed Student's t test; 20–32 kHz: NE = 16.5 ± 3.0 dB, n = 17 animals, NE+AE = 15.8 ± 2.7 dB, n = 13 animals, t(28) = 0.185, p = 0.85, two-tailed Student's t test). E, AE delivered to control mice without noise exposure had no effect on gap detection ratios (gap ratio change, control = 0.03 ± 0.02, n = 89 sound frequencies, AE-only = 0.04 ± 0.02, n = 75 sound frequencies, p = 0.59, Kolmogorov–Smirnov test). F, Same as E but for PPI inhibition of the ASR (PPI ratio change, control = −0.12 ± 0.03, n = 90 sound frequencies, AE-only = −0.11 ± 0.04, n = 77 sound frequencies, p = 0.83, Kolmogorov–Smirnov test). G, AE for 7 d delivered to control mice without noise exposure did not change ABR thresholds (10–16 kHz: median threshold before AE = 27.5 dB, after AE = 34.0 dB, n = 6 animals, p = 0.43, Wilcoxon test; 20–32 kHz: median threshold before AE = 29.2 dB, after AE = 30.8, n = 6 animals, p = 0.60, two-tailed paired t test). Data in D and G are shown as box-and-whisker plots. *p < 0.05, **p < 0.01.

