Figure 2.
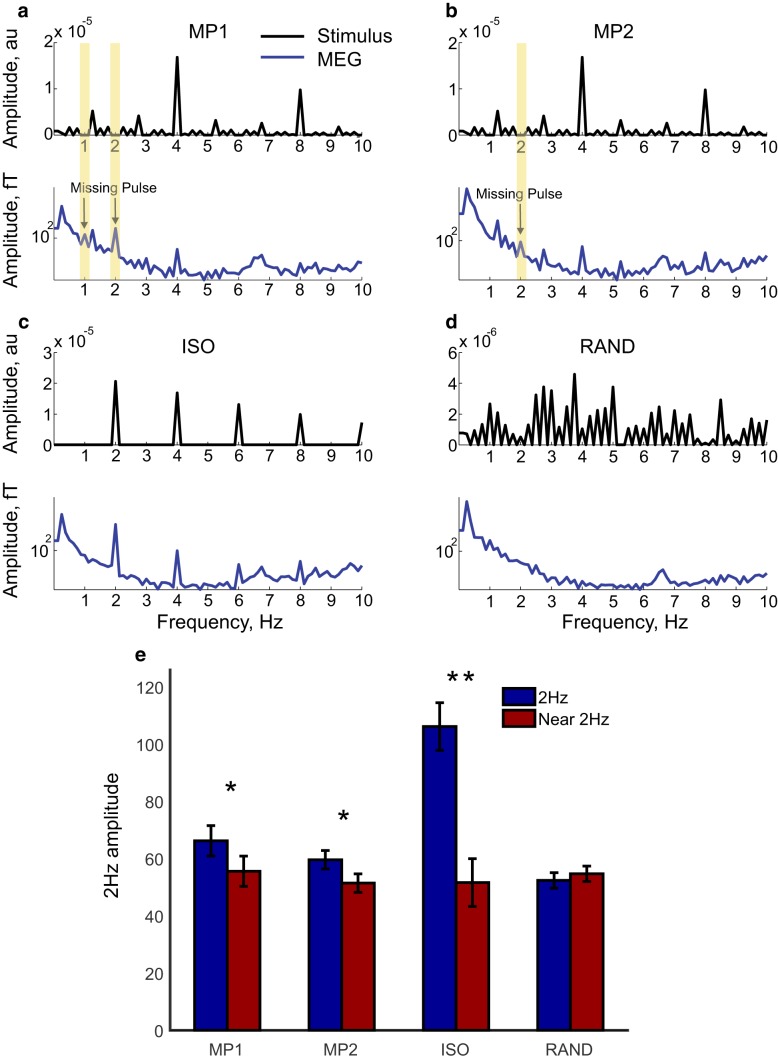
Stimulus and MEG spectrum. a–d, The modulation spectra of each stimulus (top) and of the neural response it generated, averaged over 10% of the sensors with the highest 2 Hz amplitude (bottom). a, b, Syncopated patterns MP1 and MP2. There is no visible 2 Hz peak in the stimulus spectrum. However, pulse-frequency peaks (black arrows) are observed in the MEG spectrum for both syncopated rhythms. c, ISO condition: 2 Hz peaks and its harmonics are clear in both stimulus and MEG spectrum. d, RAND pattern: 2 Hz peaks are missing in both the stimulus and the MEG spectrum. e, Amplitude at 2 Hz versus the frequencies around it for each condition. Neural data are averaged over all MEG sensors. In the ISO and both syncopated conditions there was a significant difference between 2 Hz power and the frequencies around it, indicating a peak at the pulse frequency (Wilcoxon signed-rank test, *p < 0.05, **p < 0.01). In the RAND condition, there was no significant peak at 2 Hz. Error bars indicate SEM.

