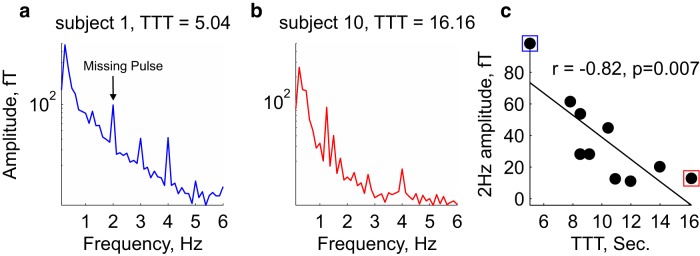
Figure 4.
MEG spectrum for individual subjects. The spectrum is shown averaged over both syncopated conditions and over seven channels (5% of the total number of channels) showing the highest 2 Hz power. a, A subject with low average TTT value, who perceived the pulse of the syncopated rhythms early on during the behavioral task. b, A subject with high TTT value. It took the subject >15 s to perceive the pulse. The MEG spectrum of the early pulse perceiver shows a clear 2 Hz peak that matches the expected pulse frequency of the stimulus while the late pulse perceiver failed to generate such oscillations. Note that both subjects showed peaks at frequencies present in the stimulus itself (e.g., 1.25 and 4 Hz). c, Correlation between 2 Hz amplitude and TTT for the two syncopated conditions. Subjects that showed higher 2 Hz amplitude during the MEG scans in the syncopated conditions perceived the pulse of the syncopated patterns and started tapping earlier during the subsequent behavioral task. Blue and red squares indicate the subjects shown in a and b respectively.

