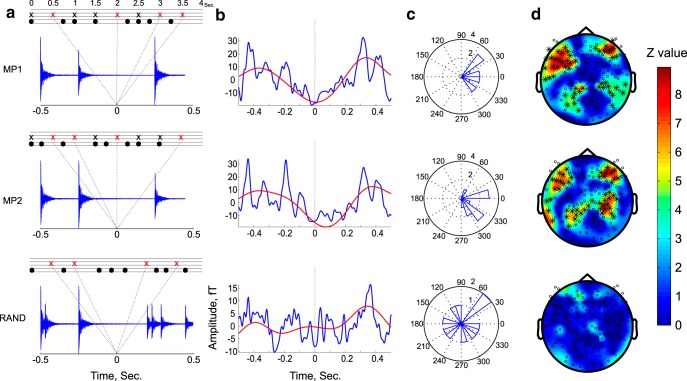
Figure 5.
Phase locking to the missing pulse for the two syncopated rhythms (MP1 and MP2; top two rows) and the RAND condition (bottom row). a, Illustration of the soundless strong-beat positions. Black dots mark the locations of each physical sound and, for the two syncopated rhythms, X's mark the strong-beat positions. Red X's denote strong-beat positions where no sounds were present, which served as t = 0 in this analysis. The bottom panels show averaged sound files time-locked to these positions, verifying that these were indeed quiet times. Similar soundless periods were selected from the RAND condition (depicted by the red X's), matched on their distance from previous sounds so as to control for carryover effects of evoked responses from previous sounds. b, MEG signals averaged over all participants for one representative MEG sensor. The signals were time-locked to the position of soundless strong beats (t = 0) in the syncopated conditions, or control epochs in the RAND condition, filtered between 1 and 40 Hz (blue) and between 0.5 and 3 Hz (red). c, Phase histograms at the time of the expected pulse, across all participants for the MEG sensor shown in b. d, Topography of the phase-locking values across MEG sensors. The colors indicate the Z value of the Rayleigh test. Significant sensors are indicated by an asterisk (p < 0.05, FDR corrected).

