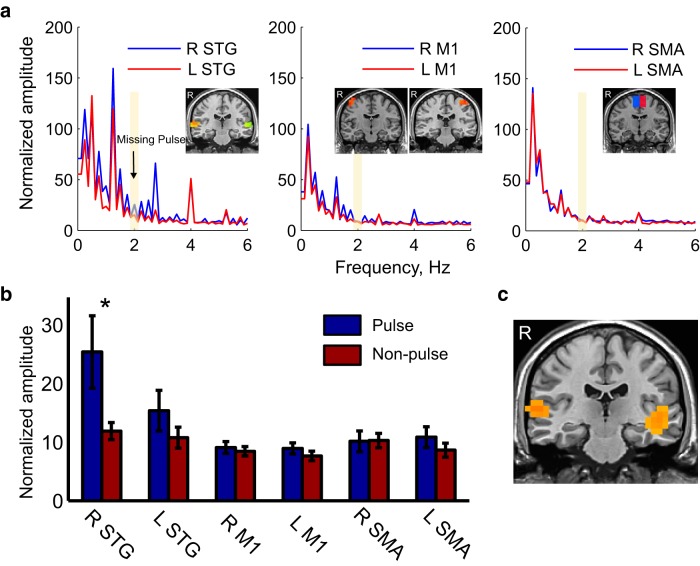
Figure 6.
Localization the missing-pulse response. a, Spectra of the neural response in response to the two syncopated rhythms in the right (blue) and left (red) hemisphere for each ROI. Inserts indicate the anatomical locations of the voxels used for each ROI (see Materials and Methods). b, Statistical comparison of 2 Hz amplitude (blue) versus amplitude in adjacent frequencies (red) in each ROI. Error bars indicate SEM. c, Whole-brain analysis of the missing-pulse response. The two clusters with the strongest missing-pulse responses were localized in the right and left STGs.

