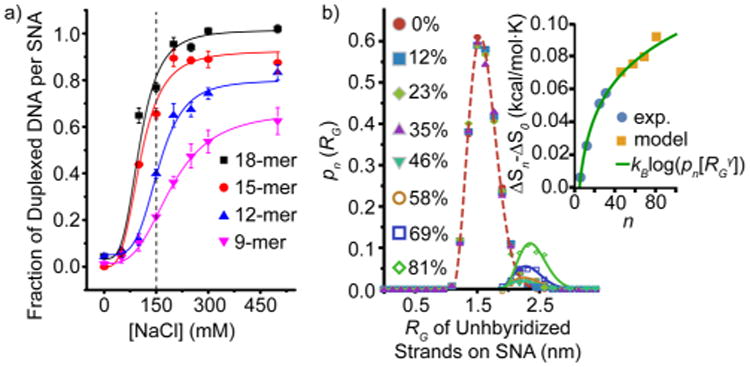
Figure 2.

(a) Quantification of the fraction of strands that hybridize to an SNA as a function of increased bulk salt concentration. The dashed line represents the salt concentration used in prior experiments. (b) Probability distribution function (PDF) from molecular dynamics simulations indicates that the radius of gyration of unhybridized DNA on the SNA elongates as more sites on the SNA are duplexed. Inset: the change in ΔS plotted over the entire range of binding site duplexation (0–80 strands), using the PDF fits and Figure 1d. The experimental and model data are fit with a scaling exponent γ = 0.55 (green line)13 that predicts the behavior of both the experimental and MD simulation data.
