Fig. 1.

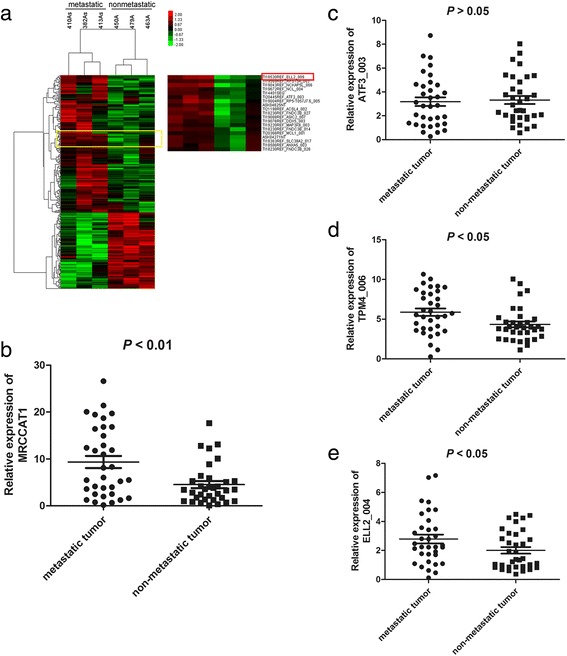
Identification of MRCCAT1 which is upregulated in metastatic ccRCC tissues. a lncRNAs microarray data of metastatic ccRCC samples compared with that of non-metastatic ccRCC samples are presented in a heat map. Red represents high expression, and green represents low expression. MRCCAT1 (TI18530REF_ELL2_009) is listed on the right. b qRT-PCR analysis of MRCCAT1 between metastatic and non-metastatic ccRCC samples. P < 0.01 by Mann-Whitney U test. c qRT-PCR analysis of ATF3_003 between metastatic and non-metastatic ccRCC primary samples. P > 0.05 by Mann-Whitney U test. d qRT-PCR analysis of TPM4_006 between metastatic and non-metastatic ccRCC primary samples. P < 0.05 by Mann-Whitney U test. e qRT-PCR analysis of ELL2_004 between metastatic and non-metastatic ccRCC primary samples. P < 0.05 by Mann-Whitney U test
