
Fig. 5.
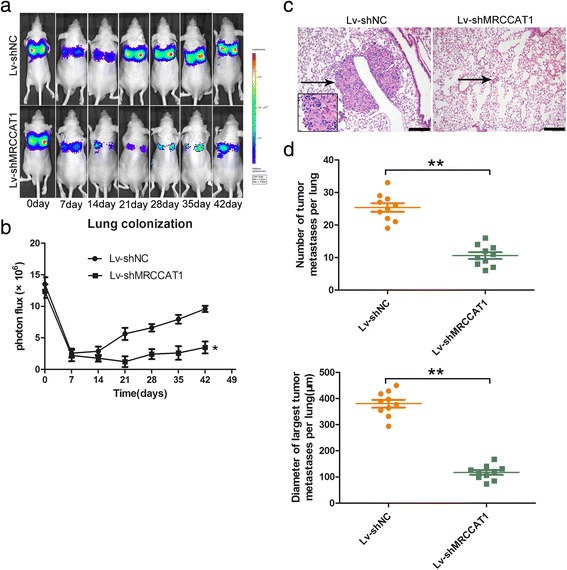
Knockdown of MRCCAT1 suppresses the metastasis of ccRCC cells in vivo. a, b Representative bioluminescent images (a) and quantification of bioluminescent imaging signal intensities (b) at each week after tail vein injection of MRCCAT1 knockdown and NC 786-O cells for 6 weeks. c Representative images of HE staining of metastatic nodules in the lungs of nude mice. The metastatic nodules are indicated by black arrows; Scale bar = 200 μm. d Upper: the numbers of metastatic tumor in nude mice lungs were calculated and compared. Lower: diameter of the largest metastatic tumor in nude mice lungs were calculated and compared. The results are presented as the mean ± SD for each group (n = 10). *P < 0.05, **P < 0.01 by Mann-Whitney U test