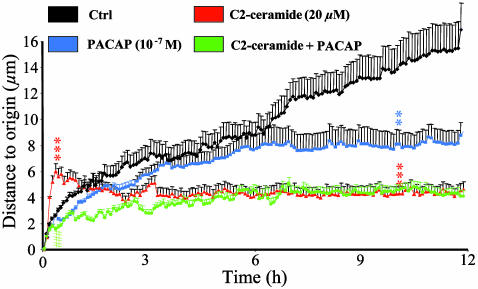
Fig. 2.
Effect of C2-ceramide, PACAP, or both on the distance to origin covered by cultured cerebellar granule cells. The curves represent the mean distance to origin covered by granule cells cultured in control conditions (black curve, n = 100) or in the presence of 20 μM C2-ceramide (red curve, n = 90), 10-7 M PACAP (blue curve, n = 80), or C2-ceramide plus PACAP (green curve, n = 85). **, P < 0.01; ***, P < 0.001 vs. control; ###, P < 0.001 vs. C2-ceramide.

