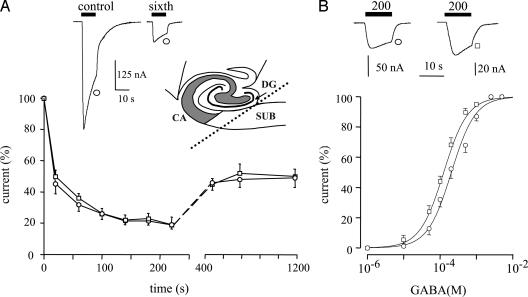
Fig. 1.
GABAA currents generated by receptors microtransplanted from the hippocampus and subiculum of a TLE patient (patient 4 in Table 2) to Xenopus oocytes. Symbols identify the tissue source of the membranes. (A) (Upper) Sample currents to the first and sixth GABA applications (1 mM, 10 s) from a membrane-injected oocyte. (Inset) Schematic representation showing the location of the subiculum (SUB), dentate gyrus (DG), and cornu ammonis (CA) hippocampal regions. (Lower) Time-course of current run-down during repetitive applications of GABA. Note the similar run-down in subiculum (○) vs. hippocampus proper (□) from the same patient. Points represent mean current amplitudes (±SEM) from six to eight oocytes (three frogs) normalized to Imax = -204 ± 29 nA (○) and -162 ± 29 nA (□). (B)(Upper) Sample currents elicited by the indicated GABA concentrations (μM) from the experiments shown below. (Lower) Dose–response relations from membrane-injected oocytes as indicated. Data are for the same patient as in A. Currents are normalized to Imax = -196 ± 14 nA (○) and -186 ± 32 nA (□) from 8–12 oocytes (six frogs). Note the shift to the right of the GABA dose–response curve for the human TLE subiculum (○) compared with the TLE hippocampus proper (□). Fitting parameters are given in Table 1.

