
Fig. 1.
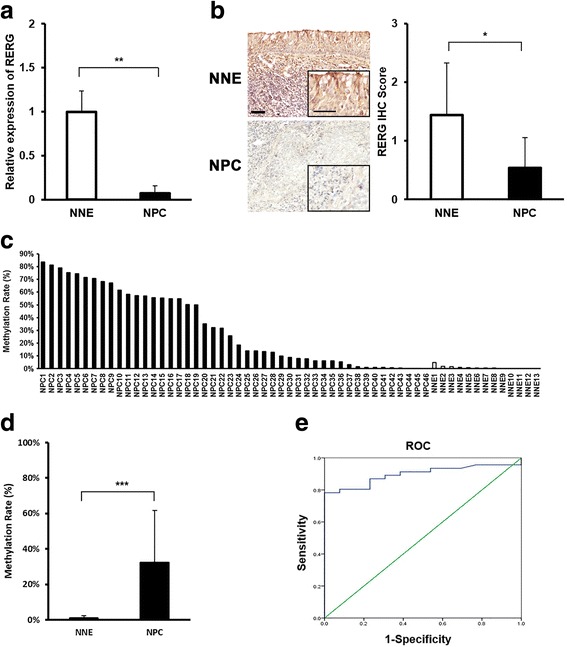
RERG was down-regulated and hypermethylated in NPC primary tumors. a Expression levels of RERG were measured in NPC primary tumor biopsies (n = 16) and NNE tissues (n = 13) by qRT-PCR. GAPDH was used as an internal control. **: P < 0.01 analyzed by Student’s t-test. b RERG was down-regulated in NPC clinical samples (n = 13) compared to NNE epithelium (n = 9) by IHC. Left: Representative photographs of IHC analyses of the expression of RERG. Original magnification is × 200, inner enlarged magnification is × 400. Bar represents 50 μm and 20 μm, respectively. Right: Graphs represent means ± SD of IHC scores of RERG in tissues of NPC and NNE. *: P < 0.05 by Mann-Whitney U test. c Each methylation rate (%) of RERG in NPC clinical samples and NNE samples by methyl qPCR. d Means ± SD of methylation rates of RERG in NPC group (n = 46) and NNE group (n = 13). ***: P < 0.001 by Student’s t-test. e ROC analysis of DNA methylation index of RERG