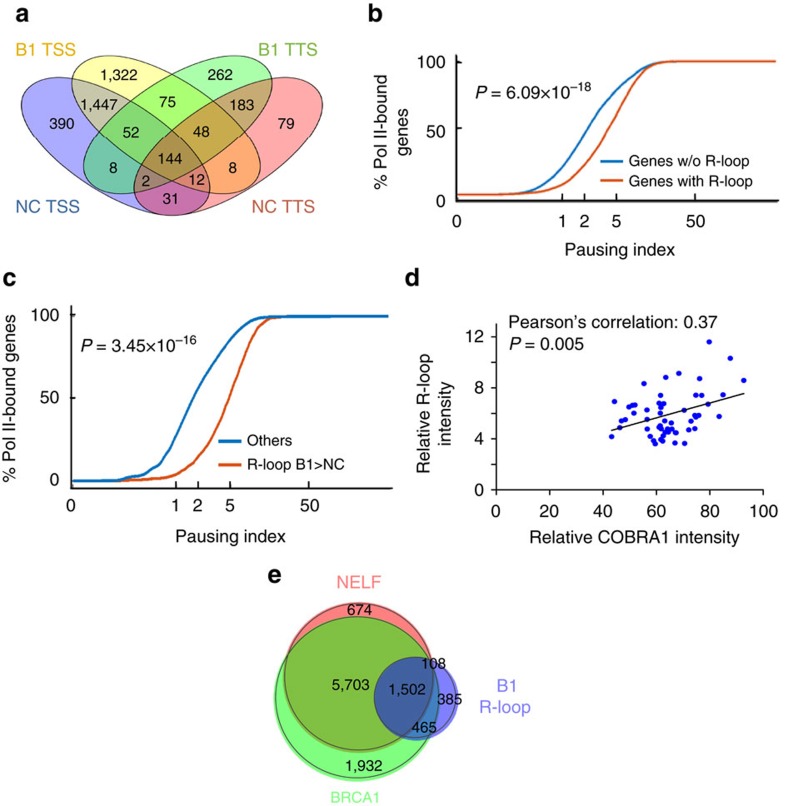
Figure 4. Association of Pol II pausing and BRCA1 mutation-related R-loop accumulation.
(a) Venn diagram depicting genes with common TSS or TTS peaks in ML of non-carriers (NC; n=4) and BRCA1 mutation carriers (B1; n=4). (b) Cumulative curve of pausing index for genes with TSS R-loop peaks (red) or without TSS R-loop peaks (blue) in K562 cells. P value was calculated using signed rank-sum test. (c) Cumulative curve of pausing index for genes with BRCA1 mutation-associated TSS R-loops (red) and the rest of the reference genes (blue) in primary mammary epithelial cells. P value was calculated using signed rank-sum test. (d) Positive correlation between human COBRA1 immunohistochemistry and R-loop staining among the 55 BRCA1 mutation carriers. P=0.005. Pearson’s correlation=0.37. (e) Venn diagram depicting the overlap between genes with TSS-bound NELF, TSS-bound BRCA1 and genes with BRCA1 mutation-associated TSS R-loops.

