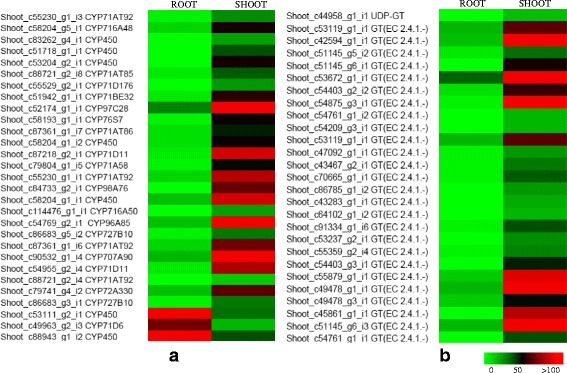
Fig. 2.

Heat map representing the tissue-specific expression of CYP450 and UGTs. Differential expression of CYP450 (a) and GTs (b) that were upregulated in shoot tissue as compared to root as the control. The fold change expression data represented here is obtained after two biological replicates with P ≥ 0.05 (significant). Colour scale representing normalized fold induction is shown in the figure
