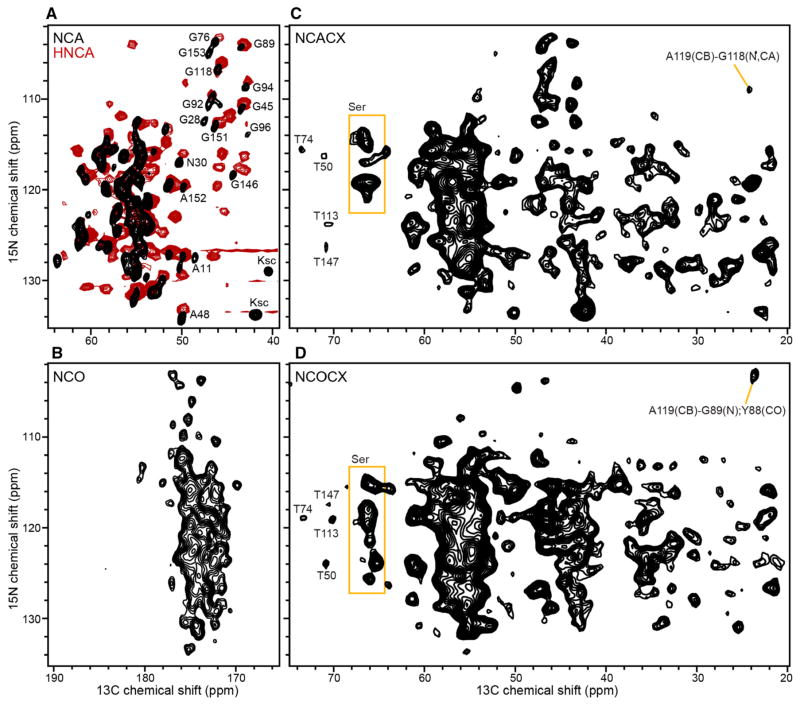
Fig. 3.
Solid-state NMR (black) and solution NMR (red) spectra of (u-15N, u-13C) Ail in lipid bilayers. a, b 2D NCA and NCO solid-state NMR spectra (black) obtained at 750 MHz, at 10 °C, with 128 scans per increment. The 2D NCA plane projection (red) from the 3D solution NMR HNCA spectrum of Ail in nanodiscs was obtained at 800 MHz, at 45 °C; additional signals in the HNCA spectrum arise from inter-residue HN and CA connectivities. c, d NCACX and NCOCX spectra obtained at 500 MHz, at 10 °C, with 400 scans per increment. Examples of resolved and assigned signals are marked

