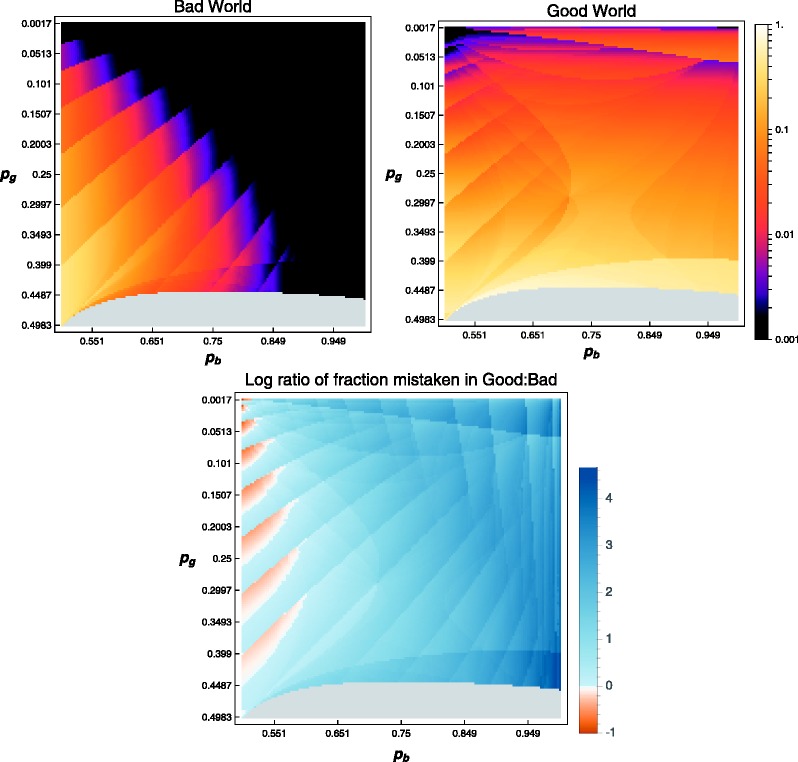
Figure A1.
Varying the probability of encountering badgers in each environment. With , C = 1 and R = 1, the upper panels show how the fraction of the population that is wrong about the environment varies as a function of the parameters pg and pb. The upper left shows the fraction that thinks the environment is good when it is actually bad. The upper right panel shows the fraction that thinks the environment is bad when it is actually good. This fraction is measured conditional on survival to the 20th time step, which is the average lifespan when . The lower panel illustrates the log (base 10) of the ratio of incorrect inference rates in good and bad environments. For a small set of parameter values (shown in orange), incorrect inferences are more common in the bad environment. The gray area in each plot is a region in which it is not worthwhile to start exploring at all

