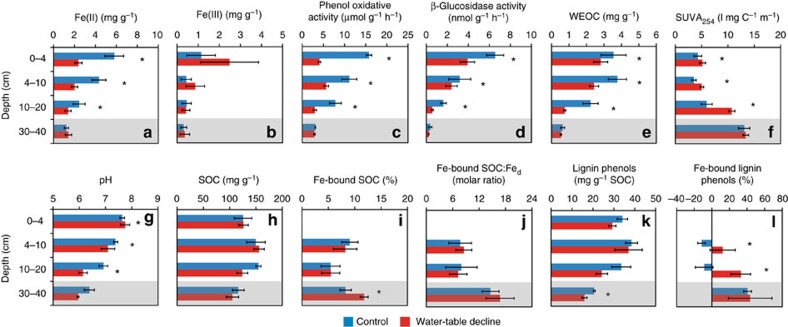
Figure 2. Changes in enzyme activities and soil chemical properties at different depths in the wetland water-table decline experiment.
(a) Ferrous iron [Fe(II)]; (b) ferric iron [Fe(III)]; (c) phenol oxidative activity; (d) β-glucosidase activity; (e) water-extractable organic carbon (WEOC); (f) specific ultraviolet absorbance at 254 nm of WEOC (SUVA254); (g) soil pH; (h) soil organic carbon (SOC); (i) iron-bound soil organic carbon (Fe-bound SOC) calculated by equation (1); (j) the molar ratio of Fe-bound SOC to dithionite-extractable iron (Fed); (k) SOC-normalized content of lignin phenols; (l) Fe-bound lignin phenols calculated by equation (2). The shaded soil layer (30–40 cm) was submerged under water in both treatments, whereas the other layers were air-exposed in the water-table decline treatment. Error bars represent s.e.m. (n=4). Asterisk denotes significant difference between control and water-table decline treatments (P<0.05). Note that Fe(II), Fe(III), pH and enzyme activities were measured for bulk soils whereas other properties were measured for the fine soil fraction (<53 μm). Fe-bound SOC and lignin phenols were not measured at 0–4 cm due to the limited sample size.

