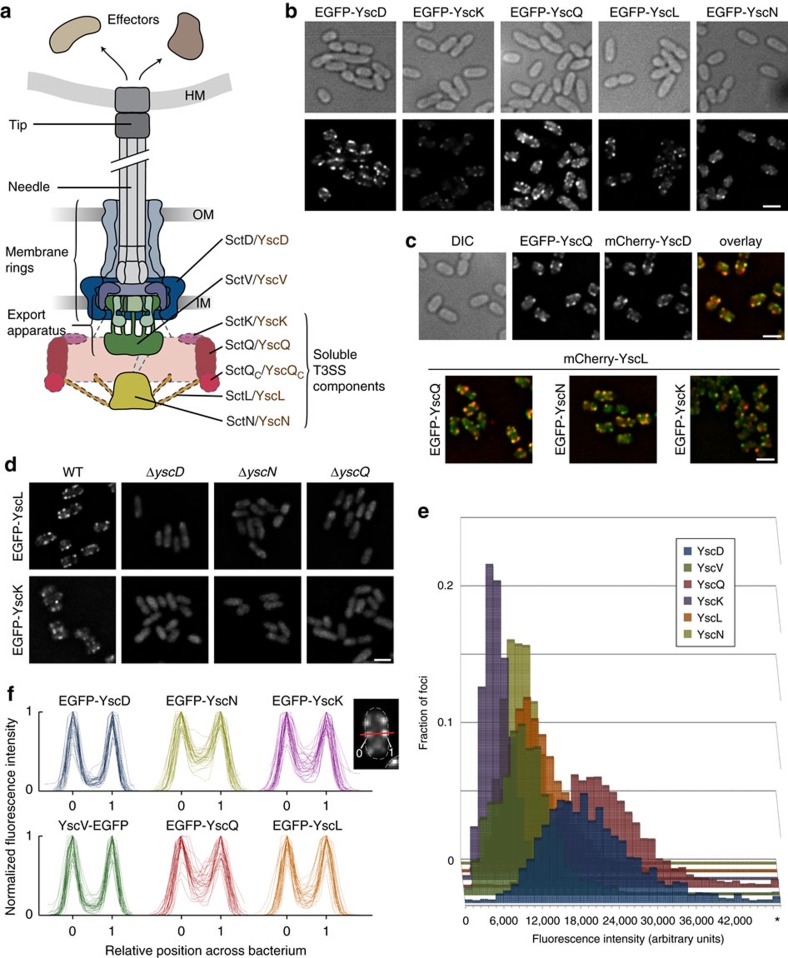
Figure 1. The soluble T3SS components form a complex at the cytosolic interface of the injectisome.
(a) Schematic overview of the T3SS injectisome (modified from ref. 71, based on cryoelectron microscopy data of purified needle complexes30). General (black) and Yersinia-specific (brown) names of the soluble T3SS components forming the cytosolic complex at the injectisome are indicated. (b). All soluble T3SS components localize in a similar manner in membrane foci, similar to the pattern of the membrane-ring component YscD. Differential interference contrast (DIC) images and respective deconvoluted GFP fluorescence micrographs of bacteria expressing N-terminal EGFP fusions of the respective proteins under non-secreting conditions (see Supplementary Fig. 2 for secreting conditions). The representative micrographs shown allow the comparison of fluorescence intensity. Each strain shown in b–d was imaged in three to six independent experiments yielding reproducible results. (c) The soluble components colocalize with each other and the basal body. DIC image, deconvoluted GFP and mCherry micrographs, and GFP/mCherry overlay of bacteria expressing the denoted labelled T3SS components under non-secreting conditions. Representative DIC and single colour GFP/mCherry fluorescence micrographs for the overlays displayed in the bottom row are shown in Supplementary Fig. 3. (d) The cytosolic complex requires each of its components to assemble at the T3SS. Micrographs of strains expressing EGFP-YscL or EGFP-YscK in a wild-type strain background or in the absence of YscD, YscN or YscQ. (e) Distribution of fluorescence intensities of foci in strains expressing the denoted T3SS components (C-terminal EGFP fusion for YscV, N-terminal EGFP fusions for all other proteins); 1,900 to 3,640 spots from 262 to 537 bacteria from six fields of view in two independent experiments per strain. (f) The soluble T3SS components YscK, YscQ, YscL and YscN are present both at the injectisome and in the cytosol of bacteria, whereas little cytosolic fluorescence is observed for the membrane components YscD and YscV. Line profiles of fluorescence crossing two fluorescent foci on opposite sides of the bacterium (see scheme) were generated for 32 bacteria from six fields of view in two independent experiments in deconvoluted micrographs of bacteria expressing N-terminal EGFP-fusions of the denoted proteins (C-terminal fusion in the case of YscV) were normalized for maximal fluorescence intensity (y-axis) and position along the bacterial diameter as indicated by the fluorescence maxima (x-axis, marks show position of the maxima) and overlaid. The scheme in the top right corner shows a representative line profile for a bacterium expressing EGFP-YscK. The red line marks the path of the intensity profile, the triangles and numbers note the intensity maxima used to normalize the diameter of the bacterium from relative position 0 to 1 and the shape of the bacterium is indicated by the dotted lines. Scale bars, 2 μm.

