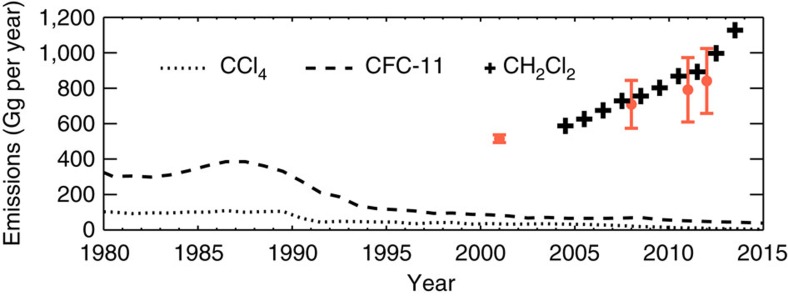
Figure 2. Time trend in global halocarbon emissions.
Emissions derived from a simple 1-box model for CCl4 (dotted line), CFC-11 (dashed line) and CH2Cl2 (crosses) in units of Gigagrams (Gg) of source gas per year. Calculation for CH2Cl2 based on a parameterized global mean lifetime of 0.43 years. Also shown are recent independent estimates of CH2Cl2 emissions (orange points) from the AGAGE 12-box model15. Error bars denote uncertainty range.

