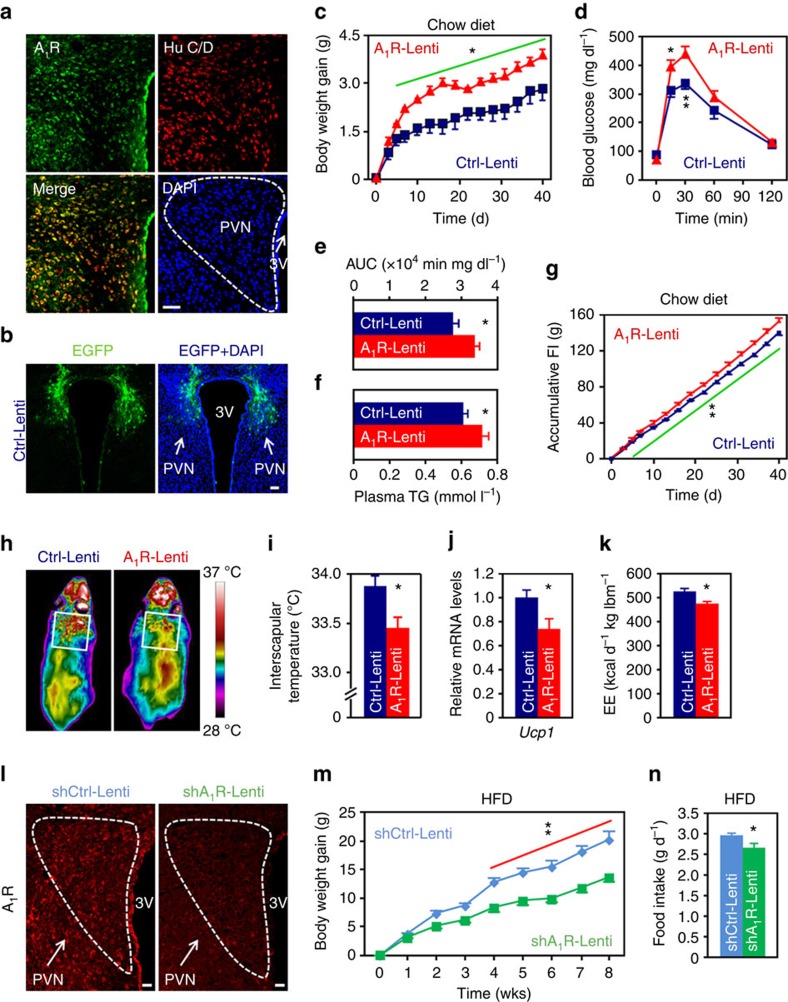
Figure 2. Effects of manipulations of A1R expression in PVN on systemic energy balance.
(a) Double immunofluorescence staining of A1R (green) and neuronal marker Hu C/D (red) in mouse PVN. Cell nuclei were counterstained with DAPI (blue). 3V, third ventricle. Scale bar, 50 μm. (b) Expression of EGFP (green) after the injection of control lentivirus (Ctrl-Lenti) into PVN. Cell nuclei were counterstained with DAPI (blue). Scale bar, 50 μm. (c–f) Body weight gain (c), GTT (d), area under the curve (AUC) of GTT (e) and plasma triglycerides (TG) levels (f) were analysed. Mice were injected either Ctrl-Lenti or A1R-Lenti virus into the PVN. Ctrl-Lenti, n=6 (c,f), 7 (d,e). A1R-Lenti, n=6 (f), 7 (c–e). (g–i) Accumulative food intake (FI) (g), representative infrared images (h) and interscapular temperatures (i) of mice injected either Ctrl-Lenti or A1R-Lenti virus into the PVN. Ctrl-Lenti, n=6 (g), 7 (i). A1R-Lenti, n=7. (j) qRT-PCR analysis of the expression level of Ucp1 in brown adipose tissue of mice injected Ctrl-Lenti (n=6) or A1R-Lenti (n=7) virus. (k) Daily energy expenditure (EE) of mice injected Ctrl-Lenti or A1R-Lenti virus. lbm, lean body mass. n=6. (l) Immunofluorescence images showing that A1R shRNA-expressing (shA1R-Lenti) lentivirus delivered into the PVN effectively reduced the expression of A1R in comparison with control (shCtrl-Lenti). 3V, third ventricle. Scale bar, 20 μm. (m,n) Body weight gain (m) and daily food intake (n) of mice injected either shCtrl-Lenti or shA1R-Lenti virus into the PVN. n=7. Data are presented as mean±s.e.m. *P<0.05, **P<0.01, two-tailed Student’s t-test (e,f,i–k,n); two-way analysis of variance (ANOVA) with Bonferroni’s post hoc test (c,d,g,m).

