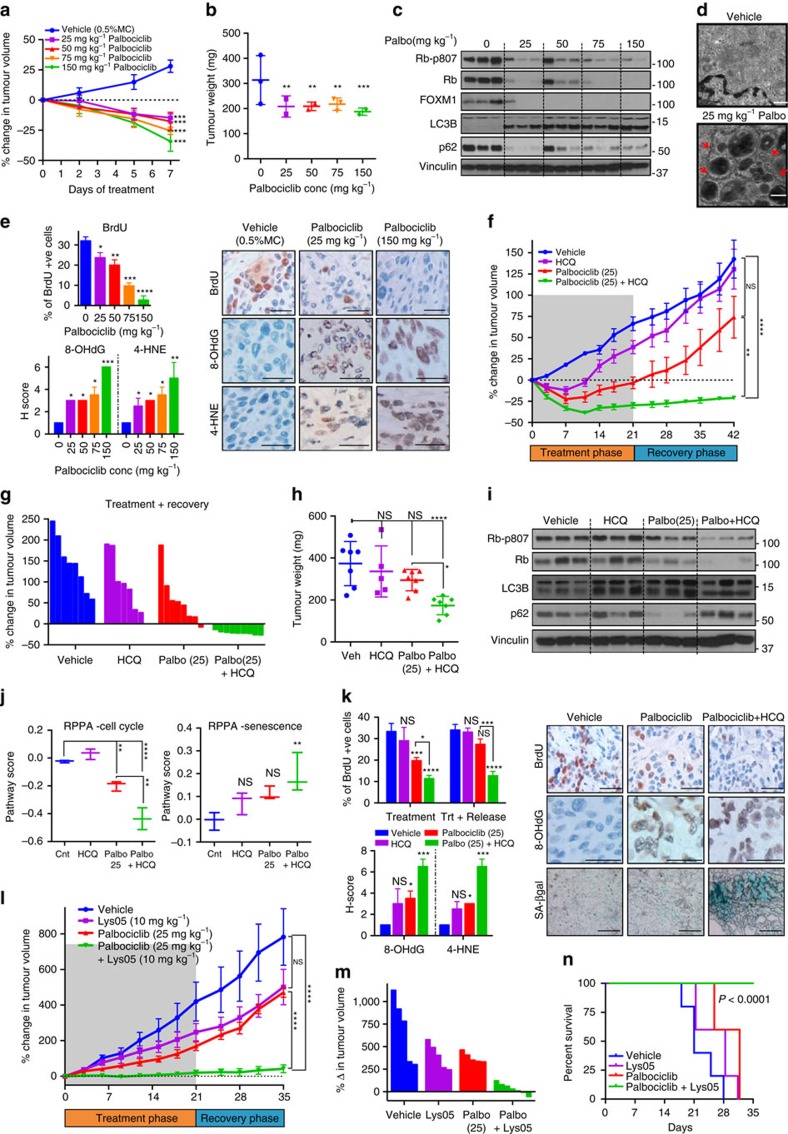
Figure 3. Palbociclib synergizes with autophagy inhibition in vivo.
(a) Percentage change in tumour volume (normalized to Day 0) upon treatment with vehicle or palbociclib (n≥4 tumours per group) daily for 7 days. Tumours were then harvested for (b) Tumour weight measurement, (c) western blot of cell cycle (phospho-Rb, Rb, FOXM1) and autophagy (LC3B, p62) proteins, (d) TEM analysis (red arrows indicate double-membraned autophagosomes; Scale bars, 500 nm) and (e) BrdU, 8-OHdG and SA-ß gal staining (Scale bars, 50 μm). (f,g) Percentage change in mean (f) or individual (g) tumour volumes (normalized to Day 0) upon treatment with Vehicle, 25 mg kg−1 palbociclib, 60 mg kg−1 HCQ or combination of palbociclib (25 mg kg−1) and HCQ daily for 21 days (treatment phase) and recovery for 21 days (recovery phase) (n≥8 tumours per group). Data represented as mean±s.e.m. Tumours were harvested for (h) tumour weight measurement at end of treatment+recovery phase (n≥6 for each group), (i) western blot of cell cycle (phospho-Rb, Rb) and autophagy (LC3B, p62) proteins, (j) RPPA analysis and Pathway score of proteins in the cell cycle (n=10) and senescence (n=13) pathways (Error bars represent maximum and minimum values) and (k) BrdU, 8-OHdG and SA-ß gal staining with representative images end of recovery phase and quantitation (Scale bars, 50 μm). (l,m) Percentage change in mean (l) or individual (m) tumour volumes (normalized to Day 0) upon treatment with Vehicle, 5 mg kg−1 palbociclib, 10 mg kg−1 Lys-05 or combination of palbociclib and Lys-05daily for 21 days (treatment phase) and recovery phase of 14 days. Data represented as mean±s.e.m. n≥5 for each group. (n) Kaplan–Meier survival curve with death and tumours exceeding 1,000 mm3 as end point upon treatment as in (l). n≥5 for each group. All data are represented as mean±s.d. and P values were calculated in comparison to mice treated with vehicle unless indicated. NS: P>0.05; *P<0.05; **P<0.01; ***P<0.001; ****P<0.0001.

