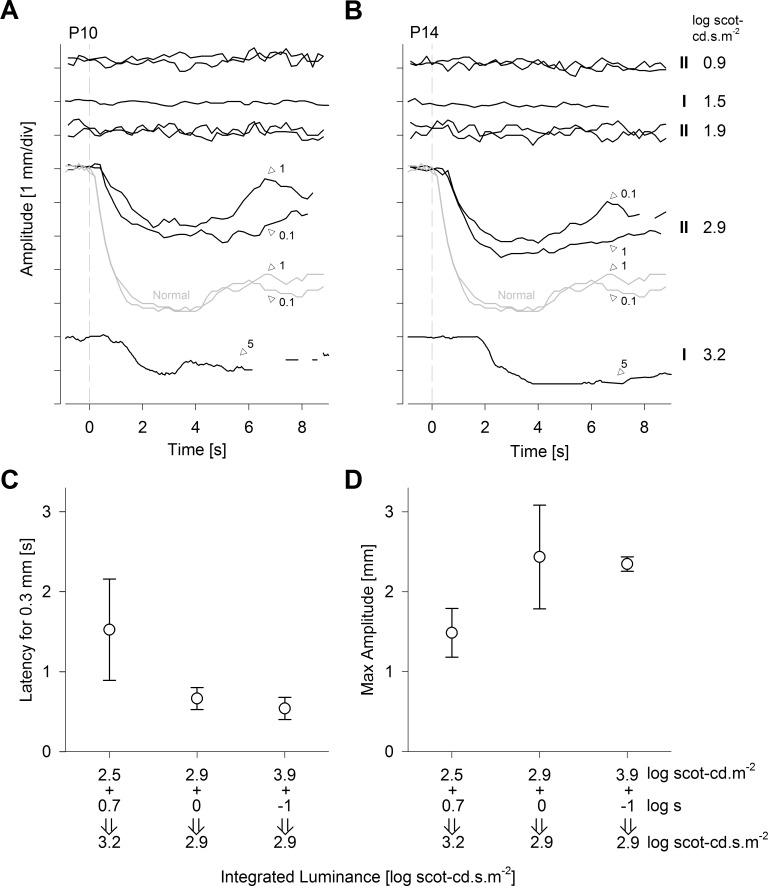
Figure 4.
Reciprocity of stimulus luminance and duration driving slow PLR. (A, B) Pupil constriction amplitudes recorded in two LCA subjects with increasing luminous energies. The pupillometer (I or II) and the luminous energy of the stimuli are shown to the right of the traces in B and stimulus durations are shown on key traces. The lowest trace of P10 is interrupted with three blinks starting around 6 seconds. (C, D) The average latency and amplitude of detectable PLRs evoked by different combinations of stimulus luminance and duration. Error bars: ± 1 SD.

