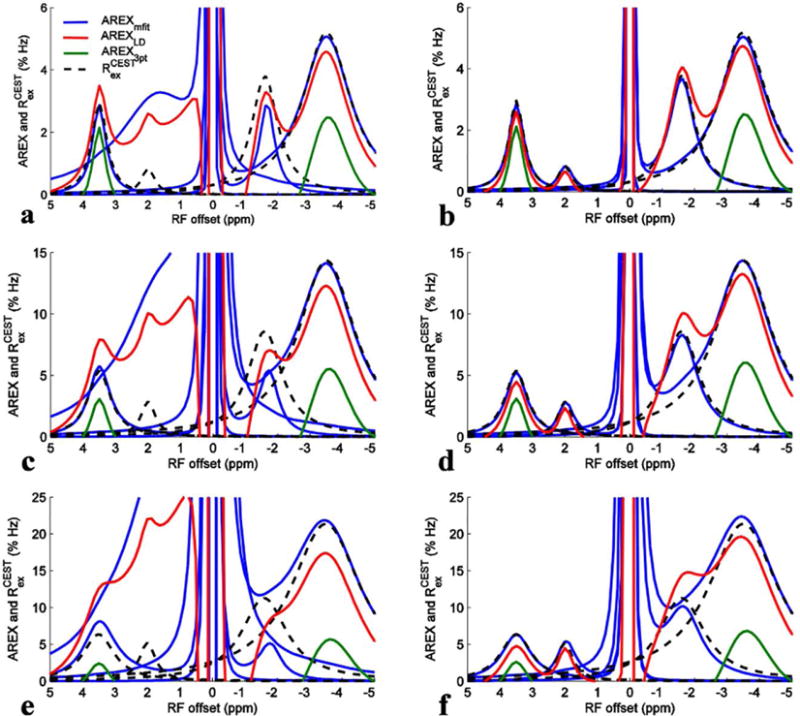
FIG. 4.

AREXmfit for amide, amine, NOE(−1.6), and NOE(−3.5) (blue) as well as AREXLD (red) and AREX3pt (green) from simulated Z-spectra with irradiation powers of 0.5 μT (a and b), 1.0 μT (c and d), and 1.5 μT (e and f). Calculated Rcestex spectra for amide, amine, NOE(−1.6), and NOE(−3.5) (dashed black) were also plotted for comparison with these three quantification methods. (a), (c), and (e) were from the seven-pool model simulations and (b), (d), and (f) were from a six-pool model (without fast exchanging amine) simulations.
