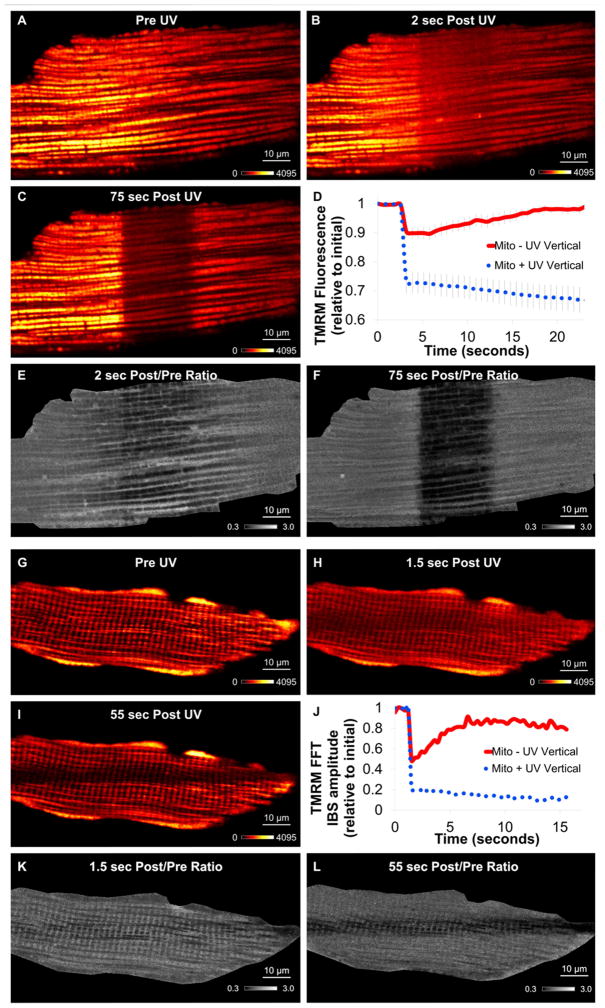
Figure 4. Mitochondrial Circuit Breaker.
TMRM fluorescence before (A), immediately after (B), and 75 seconds after (C) cardiomyocyte regional uncoupling. D) Mitochondrial TMRM timecourse of irradiated (dotted blue) and non-irradiated, depolarized (solid red) regions. Data = mean ± SE. E) Ratio TMRM image before and immediately after irradiation. F) Ratio TMRM image before and 75 sec after UV. Represent 7 experiments, 3 mice. G–I) TMRM fluorescence during muscle fiber regional uncoupling. G) Pre UV. H) Immediately after UV. I) 55 seconds after UV. J) Representative TMRM fast fourier transform (FFT) 0.5 μm−1 frequency amplitude timecourse of irradiated (dotted blue) and non-irradiated (solid red) regions. K) Ratio TMRM image before and immediately after irradiation. L) Ratio TMRM image before and 55 sec after UV. Represents 5 experiments, 5 mice. See Movies S3.

