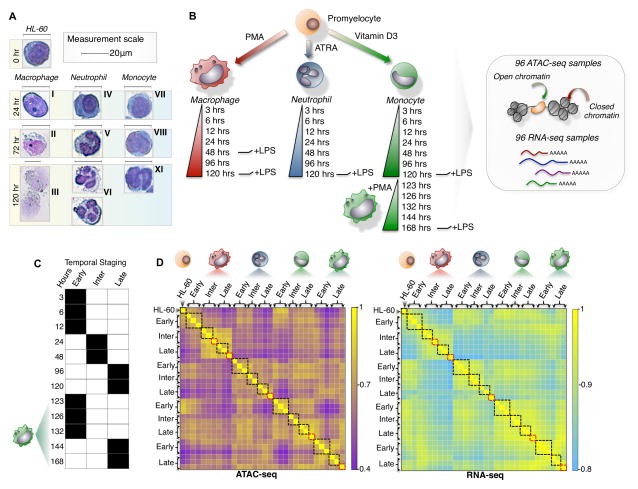
Figure 1. A dynamic model of human myeloid differentiation using HL-60s.
(A) HL-60 directed differentiation of neutrophil, monocyte, and macrophage show cell intermediates at varying time-points using Giemsa staining. Intermediate progenitors were characterized based on morphology during the course of differentiation and categorized as: (I) immature macrophage, (II) macrophage < 20μm, (III) macrophage > 20μm, (IV) myelocyte, (V) banded neutrophil, (VI) segmented neutrophil, (VII) monoblast, (VIII) promonocyte, (IX) monocyte. Scale indicates 20μm. (B) Schematic outline of study design. Colored cell identifier denotes myeloid cell-types. (C) Temporal staging of time-points for each cell-type was based on the clustering of RNA-seq and ATAC-seq data. (D) Genome-wide clustering reveals inherent structure of the transcriptome and chromatin landscape during myeloid differentiation (Pearson correlation). Black boxes mark samples grouped as temporal stages. Red boxes indicate LPS induced time-points.

