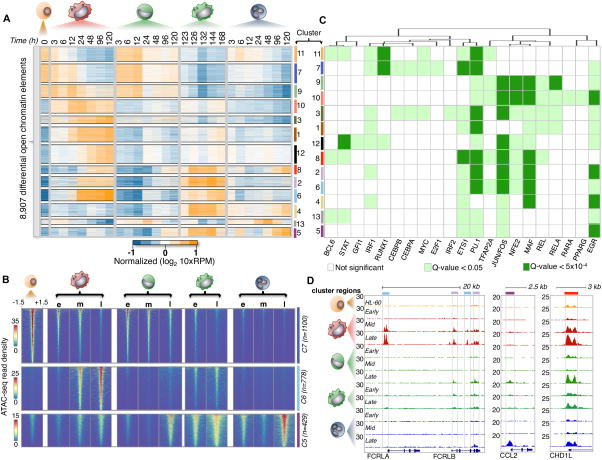
Figure 4. Temporal modules of differential chromatin accessibility.
(A) Heatmap of 8,919 differential accessible chromatin elements during myeloid differentiation (α=0.05, FDR < 1%, p-val < 0.01). 13 expression clusters were derived using k-means and denoted by both color and number for all chromatin elements. 10xRPM (Reads Per Million) values are log transformed and row-mean normalized. (B) Heatmaps showing ATAC-seq read density of chromatin elements from three clusters (5,6, and 7). Mean ATAC-seq read density was derived using temporal stages (e:Early, m: Middle, l: Late). ATAC-seq signal is shown for a window of +/−1.5 kb from the chromatin element center and ranked from strongest to weakest for all comparisons. Cluster size (n) is denoted. (C) Heatmap of de novo motif transcription factor enrichment. Rows indicate cluster of chromatin elements mined for motifs, while columns indicate transcription factor motif of interest. Transcription factor motifs were hierarchically clustered based on significance using a Euclidean distance. Non-significant motifs are represented as white boxes. Motif significance is shown for a q-val < 0.05 and q-val < 5×10⁻⁴ denoted by light or dark green boxes respectively. (D) Examples of chromatin element clusters specified during differentiation. Browser tracks of ATAC-seq data for all cell-types are normalized by read density. Chromatin elements from two differing cluster profiles reflect the complex regulatory diversity (left browser panel) during myeloid differentiation. Cell-specific chromatin accessibility is strongly enriched in neutrophils (middle panel), while temporal changes in chromatin element accessibility can be observed across all cell-types (last panel). Colored boxes identify with chromatin cluster.

