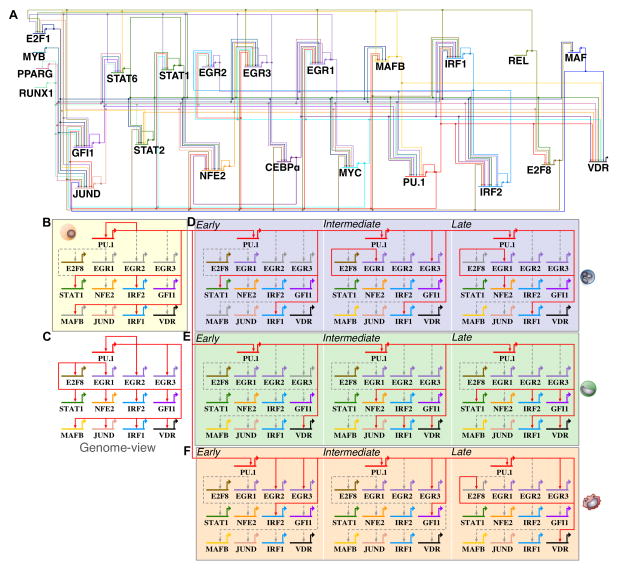
Figure 5. PU.1–regulated targets change in differentiating human myeloid cell types.
(A) A comprehensive ‘genome-view’ gene regulatory network snapshot of 23 transcriptional regulators and 158 inferred regulatory interactions were generated from ATAC-seq footprinting (Supplemental methods). The ‘genome-view’ network representation shows all inferred interactions during human myeloid differentiation. Each TF regulator is assigned a unique color identifier to track changes in regulatory interactions during differentiation. (B) PU.1 sub-circuit of regulatory interactions in undifferentiated HL-60 cells. (C) Genome-view of the PU.1 sub-circuitry in myeloid cells. We inferred 13 PU.1-mediated core regulatory interactions. (D) PU.1 sub-circuitry of differentiating neutrophils. (E) PU.1 sub-circuitry of differentiating monocytes. (F) PU.1 sub-circuitry of differentiating macrophage. Colored edges indicate that a regulatory interaction was observed for the respective time-point. Dashed grey edges indicate regulatory interactions observed at other time-points or cell-types respectively. Colored grey gene arrows indicate no mRNA detected at a given time-point.

