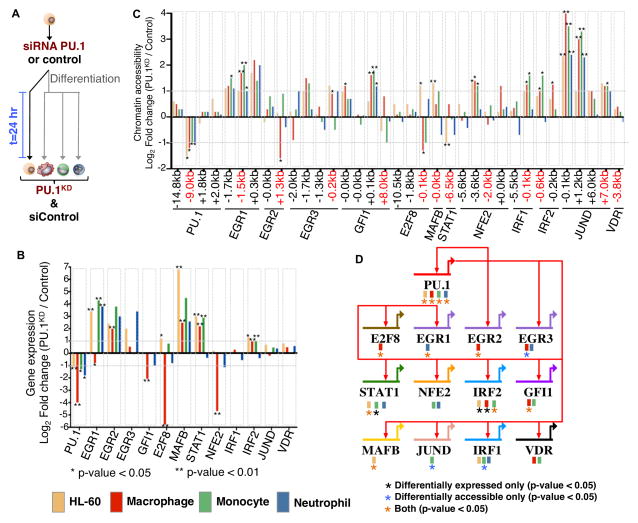
Figure 6. PU.1–regulated targets change in differentiated human myeloid cell types.
(A) Undifferentiated HL-60 were treated with a PU.1 siRNA or control siRNA. HL-60 cells were then induced to differentiate into macrophages, monocytes, and neutrophils and harvested 24-hours post siRNA treatment. Undifferentiated HL-60 cells were also measured following siRNA treatment for 24 hours. (B) mRNA fold change (Log2 transformed) between PU.1KD and siControl is shown for each PU.1 target from our gene regulatory network. Differential expression significance was calculated using biological replicates (Supplemental Methods). * p-value < 0.05; ** p-value < 0.01. (C) Chromatin accessibility fold change (Log2) between PU.1KD and control conditions is shown for PU.1 associated elements and chromatin elements near regulators. Distance of chromatin element to start of each gene is indicated. Differential accessibility is indicated * p-value < 0.05; ** p-value < 0.01. (D) Genome-view of the PU.1 sub-circuitry in myeloid cells. PU.1 regulatory interactions are specified as red arrows in our circuit diagram. Colored boxes underneath gene names indicate the cell-type origin of the PU.1 mediated interaction. Black asterisk indicates a change in PU.1 target by gene expression only. Blue asterisk indicates a change in PU.1 target by chromatin accessibility only. Orange asterisk indicates a change in PU.1 target detected by both gene expression and chromatin accessibility. Significance is indicated by a p-value < 0.05.

