
Figure 1. Distribution of blood-lead levels at age 11 years in Dunedin cohort children grouped by socioeconomic status.
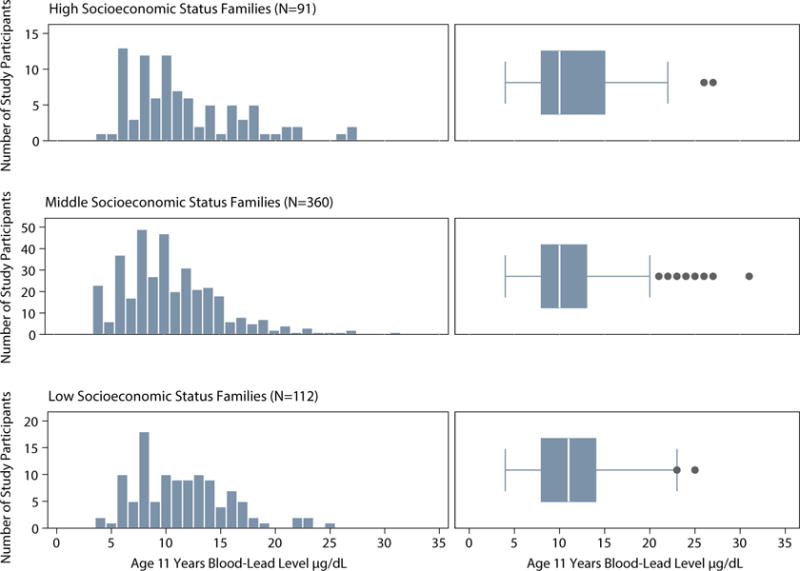
Note. Histograms and box plots depicting the distribution of childhood blood-lead levels for participants from low, middle, and high socioeconomic status families based on the 6-point Elley-Irving scale coding participants’ parents’ occupations and their associated income and education levels. Low childhood family socioeconomic status includes categories 1 and 2 on the 6-point scale; middle status includes categories 3 and 4; high status includes categories 5 and 6. Histogram interval bins represent whole integers of blood-lead level. Shown in each box plot are the median value (white line), the 25th and 75th percentiles (box outer borders), and a lower-bound value equal to the 25th percentile minus 150% of the interquartile range and an upper-bound value equal to the 75th percentile plus 150% of the interquartile range (whiskers). High blood-lead levels were observed in all status groups. N=563 (two participants were not assigned a childhood socioeconomic status score).