Figure 2.
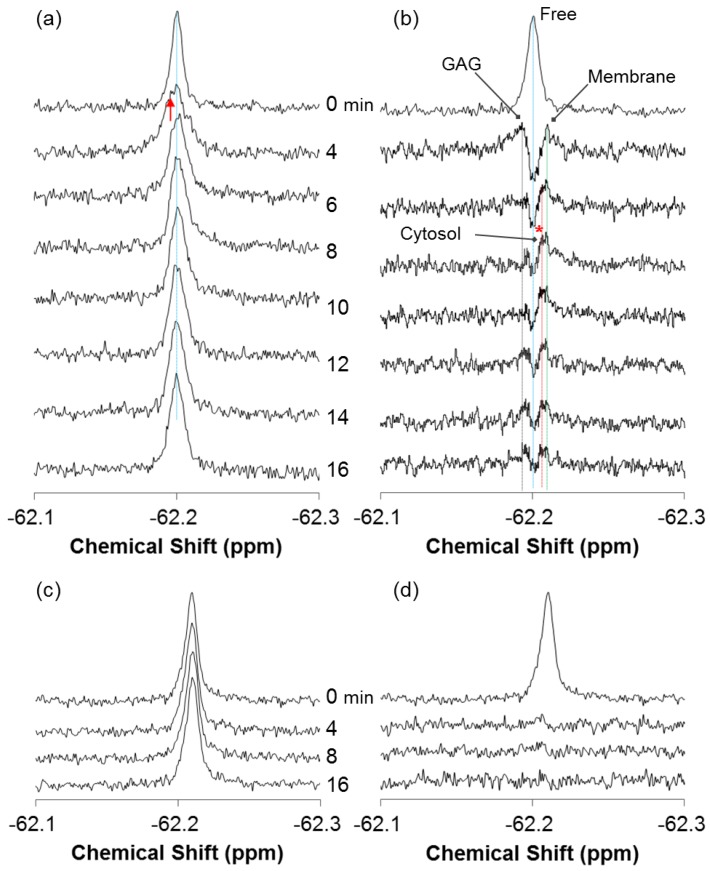
Real-time in-cell 19F NMR spectra of 19F-R8 and 19F-T6 at 4 °C. (a) An expansion of the typical 19F NMR spectra of 80 μM 19F-R8 (Figure 1a) in PBS (0 min), and 4, 6, 8, 10, 12, 14 and 16 min after the addition to HL60 cells at 4 °C. The peak top of 19F-R8 in the absence of cells (0 min) is designated by blue dotted line. The red arrow indicates a new component observed at the first step after addition to cells. (b) The difference spectra obtained by subtracting the spectrum of 19F-R8 in PBS (0 min) from the respective spectra of Figure 2a in the presence of HL60 cells. Note that the top spectrum (Free) in Figure 2b is the 19F NMR spectrum of 19F-R8 in PBS (0 min). Four components of 19F-R8 in cell outside (Free), bound to glycosaminoglycan (GAG), bound to cell membrane (Membrane), and in cytosol (Cytosol, *) are designated by the dotted lines in blue, black, green, and red, respectively. For comparison, the real-time in-cell 19F NMR (c) and the difference spectra (d) of 100 μM 19F-T6 in PBS (0 min), and at 4, 8, and 16 min after the addition to HL60 cells are also shown. The upper spectrum in (d) represents 19F-T6 in PBS (0 min).

