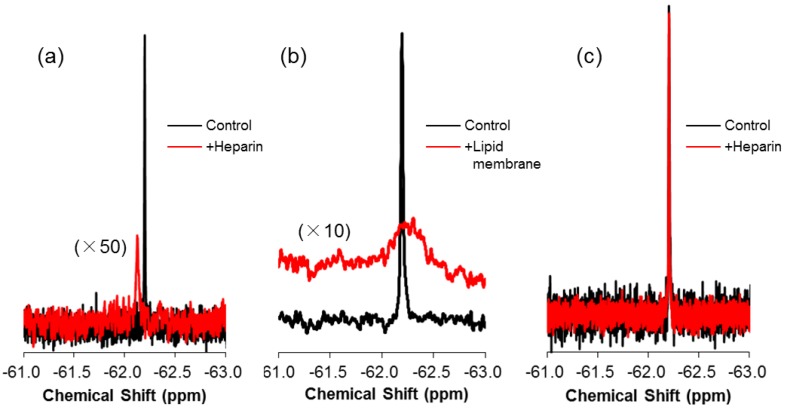
Figure 3.
19F NMR spectra of 19F-R8 in the presence of heparin and lipid membrane. 19F NMR spectra of 80 μM 19F-R8 in the presence (red) and absence (black) of (a) 80 μM heparin and (b) a 40-mM EPC/EPG bilayer membrane at 4 °C (pH 7.4). The spectra of 100 μM 19F-T6 in the presence of 200 μM of heparin is also shown in (c) for comparison.

