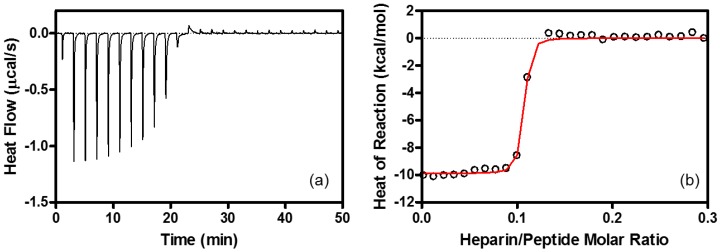
Figure 4.
ITC associated with the interaction between R8 and heparin. (a) ITC for heparin (100 μM) injection into R8 (45 μM) at 25 °C. Each peak in heat flow chart corresponds to the injection of 1.0 μL aliquots of heparin. (b) Heat reactions (integrated from the calorimetric trace, and corrected for the dilution control) plotted as a function of heparin/peptide molar ratio. The solid line is the best fit to the experimental data. Buffer: 10 mM Tris-HCl buffer containing 15 mM NaCl at pH 7.4. The calculated parameters are listed in Table 1.

