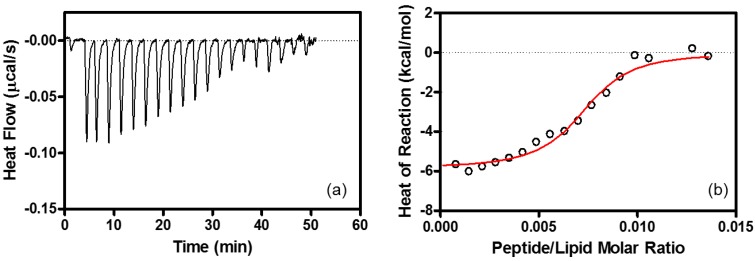
Figure 5.
ITC associated with the interaction between R8 and lipid membrane. (a) ITC for R8 (51 μM) injection into EPC/EPG LUV (500 μM) at 25 °C. Each peak in heat flow chart corresponds to the injection of 2.0-μL aliquots of R8. (b) Heat reaction (integrated from the calorimetric trace, and corrected for the dilution control) plotted as a function of peptide/lipid molar ratio. The solid line is the best fit to the experimental data. Buffer: 10 mM Tris-HCl buffer containing 15 mM NaCl at pH 7.4. The calculated parameters are listed in Table 1.

