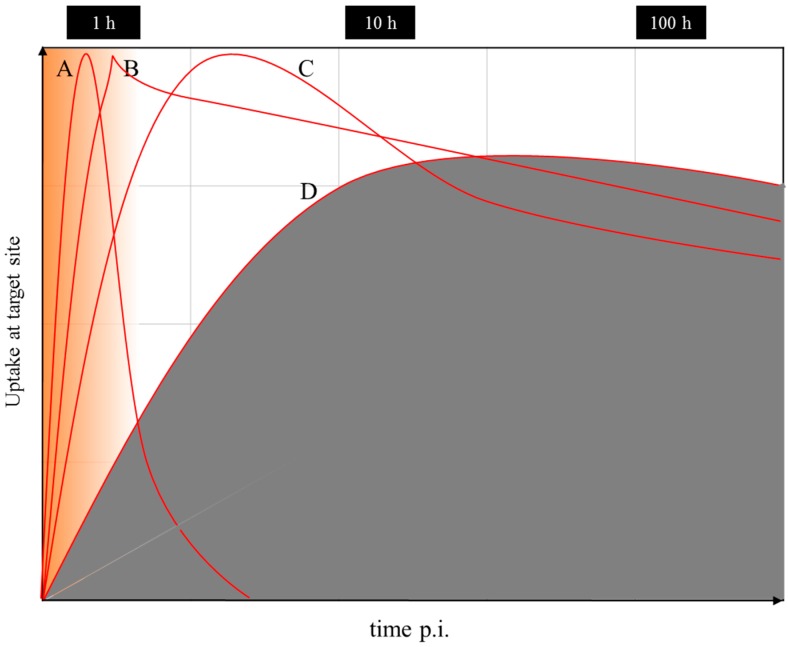
Figure 17.
Uptake kinetics of a hypothetical radiotherapeutic compound labelled with, for example, 90Y, 177Lu or 225Ac, in the target tissue is given in grey. Note the logarithmic time scale. (A) Example of fast accumulation and fast clearance from the target tissue. (B) Example of fast accumulation and slow release. (C) Example of medium accumulation and medium release kinetics. (D) Example of slow accumulation and slow release. The region of uptake kinetics, which can be covered by a 68Ga-labelled analogue, is given in orange.

