. 2015 Mar 23;6(5):3217–3224. doi: 10.1039/c5sc00190k

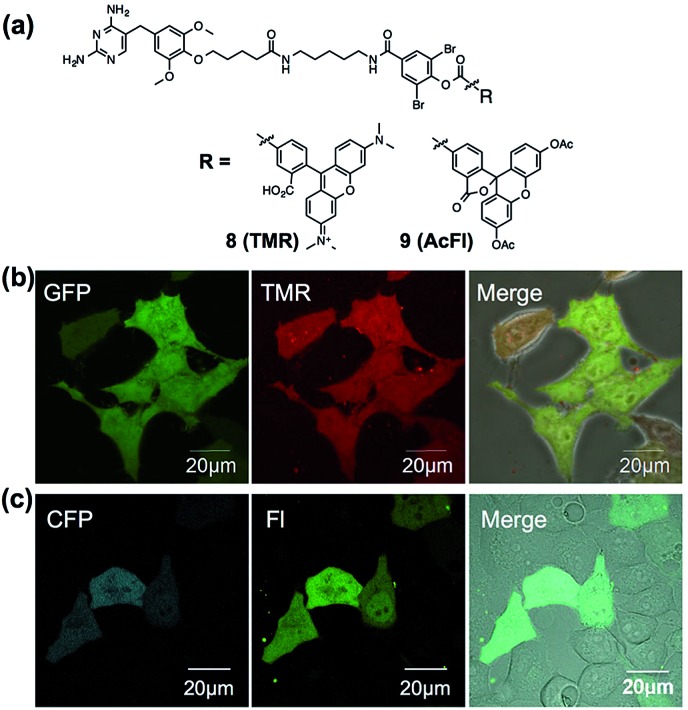
Fig. 5. (a) Chemical structures of LDBB reagents 8 and 9. (b) Live-cell imaging of eDHFR–GFP with 8 (20 nM) in HeLa-DG cells. Fluorescence images of GFP, TMR and their merged phase contrast images are displayed in the left, middle and right of each panel, respectively. Images of GFP were obtained at an excitation of 473 nm using a 490–520 nm emission filter and those of TMR were obtained at an excitation of 559 nm using a 570–670 nm emission filter, respectively. (c) Live-cell imaging of eDHFR-CFP by 9 (50 nM) in HeLa cells expressing eDHFR-CFP. Fluorescence images of CFP, fluorescein (FL) and their merged differential interference contrast images are displayed in the left, middle and right of each panel, respectively. Images of CFP were obtained at an excitation of 457 nm using a 470–490 nm emission filter and those of fluorescein (FL) were obtained at an excitation of 515 nm using a 520–620 nm emission filter. Scale bar: 20 μm.

Fig. 5