. 2015 Mar 26;6(6):3365–3372. doi: 10.1039/c5sc00471c

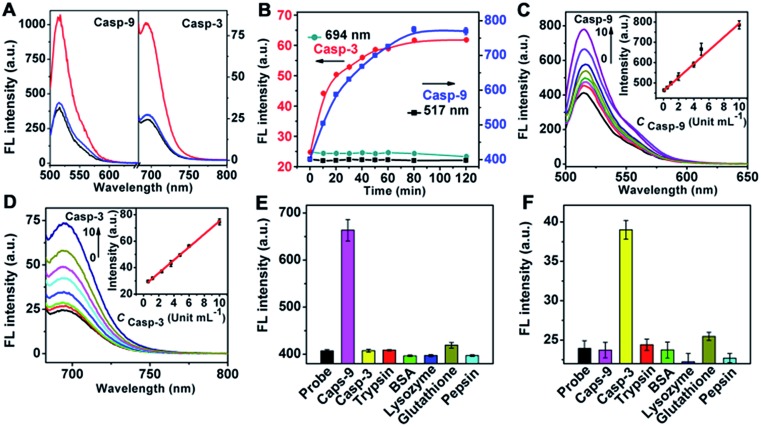
Fig. 1. (A) Fluorescence spectra of nanoprobe (OD787nm = 0.5, black) and its mixtures with casp-9 or casp-3 (20 Unit mL–1) in the absence (red) and presence (blue) of casp-9 or casp-3 inhibitor (10 μM). (B) Time-dependent fluorescence responses of nanoprobe (10 μL) in the absence (black) and presence (blue) of casp-9 (8.0 Unit mL–1) at 517 nm, and in the absence (green) and presence (red) of casp-3 (8.0 Unit mL–1) at 694 nm. (C and D) Fluorescence spectra of nanoprobe (10 μL) after incubation with (C) 0, 0.1, 0.5, 1.0, 2.0, 4.0, 5.0 and 10 Unit mL–1 casp-9 and (D) 0, 0.6, 1.2, 2.4, 3.6, 4.8, 6.0 and 10 Unit mL–1 casp-3 for 80 min. Insets: plots of FL intensity vs. casp-9 and casp-3 concentration. Fluorescent response of nanoprobe at (E) 517 and (F) 694 nm to casp-9 (5.0 Unit mL–1), casp-3 (5.0 Unit mL–1), glutathione (1.0 mM) and other proteins (1.0 μM).

Fig. 1