
Figure 5. Cell orientation follows the plant’s topographical cues.
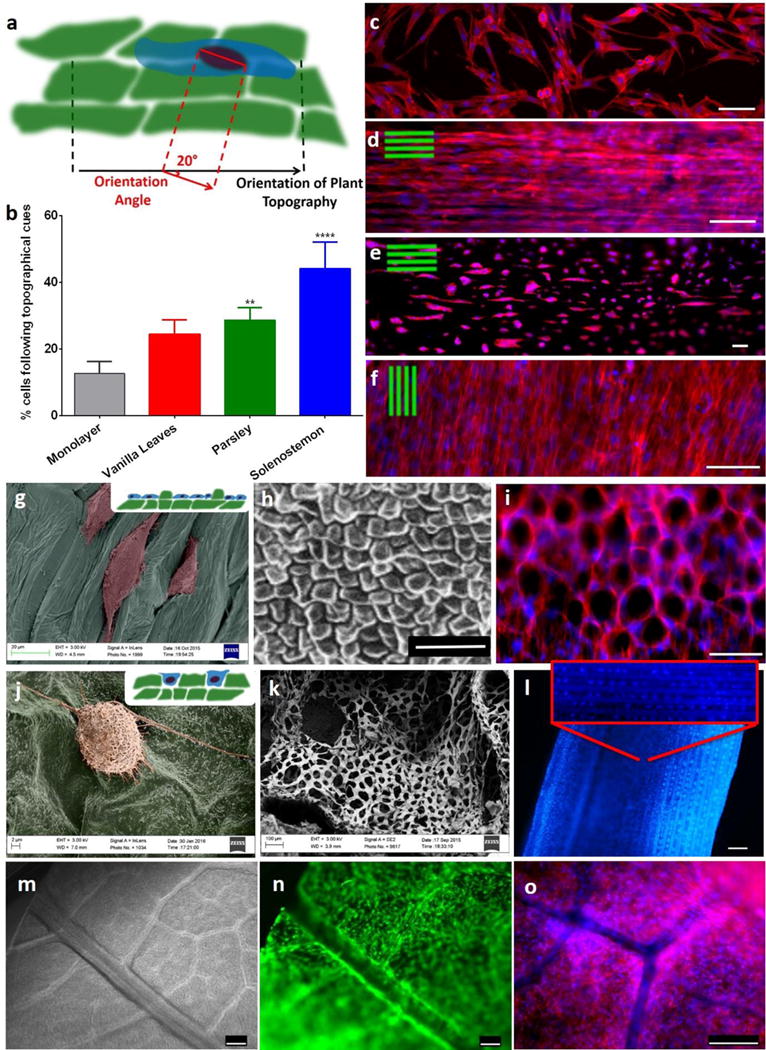
a, Conceptual illustration of the method used for the quantification of orientation angle (OA) between the mammalian cell and the underlying plant structure. b, Only 15% of the cells seeded on monolayer had an OA < 20°, whereas more than 40% of the cells seeded on Solenostemon were aligned with the stem’s topography (OA<20°). n=3, p<0.05, One-way ANOVA followed by Dunnett’s multiple comparisons test. c–f, Rhodamine-phalloidin staining of actin filaments (red) and DAPI staining of nuclei (blue) of hDFs cultured on monolayer (c), Solenostemon (d), Parsley (e), and Vanilla leaves (f), scalebars 100 μm. Cells appear to follow the topographical cues of each of the plant tissues. g, Color-enhanced SEM micrograph of hDFs seeded on parsley stems shows that cells grow preferably in the concave areas of the plant tissues. h, SEM micrograph displaying the surface topography of an Anthurium waroqueanum stem. i, hDF seeded on Anthurium stems conform into a pattern reminiscent of the plant topography. Actin filaments were stained red with Rhodamine-phalloidine nuclei stained blue with dapi. j, Color-enhanced SEM micrograph displaying a hDF cell adhering on the surface of a summer lilac leaf. k, SEM micrograph showing a cross-section of a Schoenoplectus tabernaemontani stem. l, DAPI staining of hDF cultured on a Schoenoplectus tabernaemontani stem for 30 days. Scalebar 250 μm. m, Brightfield image of a summer lilac leaf after decellularization. Our decellularization protocol allowed for maintenance of the vasculature of the leaf. n–o, hDF seeded on a summer lilac leaf and live-stained with calcein (n) or stained using rhodamine-phalloidine, DAPI (o). Cells were expanded on the leaves for 4 days, and during this period they populated the entire leaf and grew around the vasculature, thereby using the leaf’s structure as a template. Scalebars 250 μm.