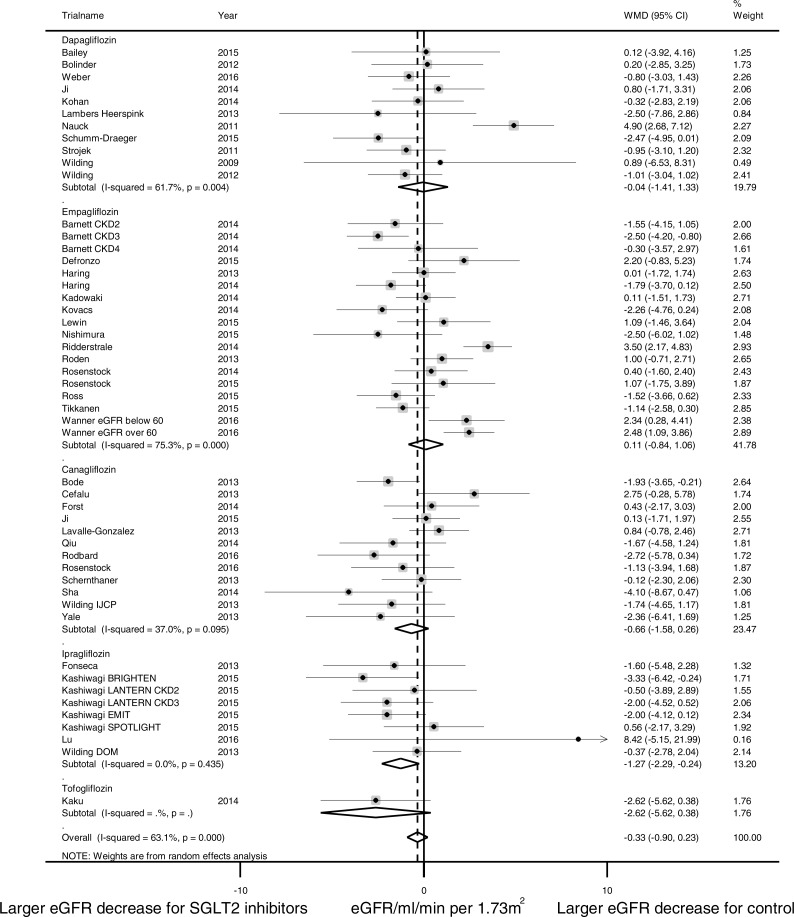
Figure 2. Effect of SGLT2 inhibition on eGFR.
The black dots represent mean differences of changes in eGFR, calculated as ((end of trial eGFR for SGLT2 inhibition–baseline eGFR for SGLT2 inhibition)–(end of trial eGFR for control—baseline eGFR for control)). The gray squares represent weights calculated using the random-effects model. The horizontal lines represent 95% confidence intervals (CIs). The hollow diamonds represent pooled mean differences and their 95% CIs. Negative values indicate that SGLT2 inhibitors had larger eGFR decrease than control. eGFR in ml/min per 1.73 m2.

