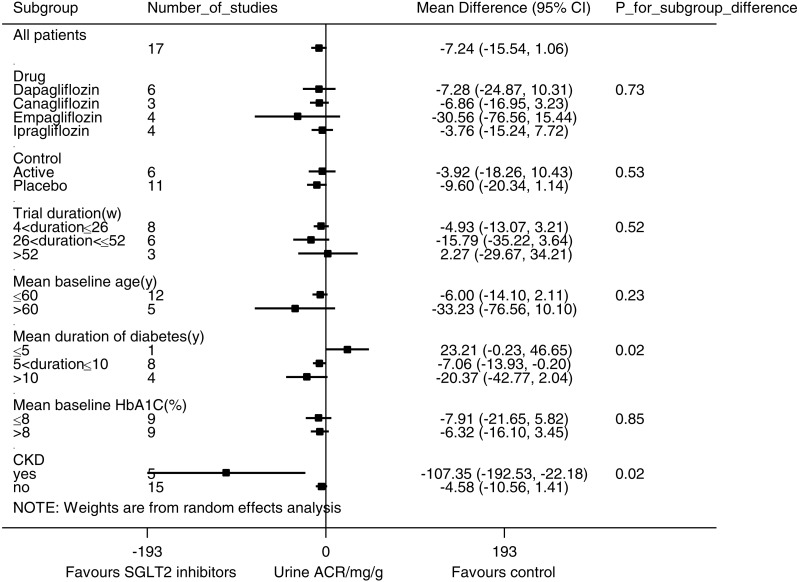
Figure 5. Subgroup analysis of the effect of SGLT2 inhibition on urine albumin/creatinine ratio (ACR).
Pre-specified subgroup analyses were performed to address sources of heterogeneity. Weighted mean differences for urine ACR are represented by small squares. The horizontal lines show 95% confidence intervals. The P values for subgroup differences are listed. Negative values indicate that the SGLT2 inhibition group had less albuminuria than the control group.

