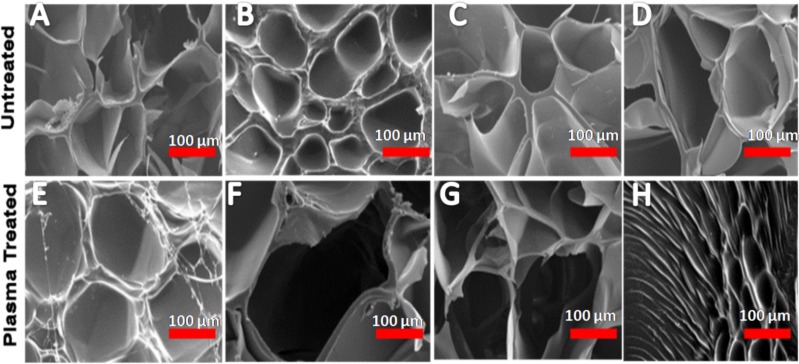
Figure 4. Scanning electron microscopy.
Morphological observations and representative scanning electron microscopic images of various concentrations of gelatin—graphene oxide nanocomposite material before (A) 7%, (B) 8%, (C) 9%, (D) 10% and after cross-linking (E) 7%, (F) 8%, (G) 9%, (H) 10% showing 8% purified gelatin achieving highest pore size 287 ± 27 µm after microplasma treatment. Scale bars: 100 µm.

