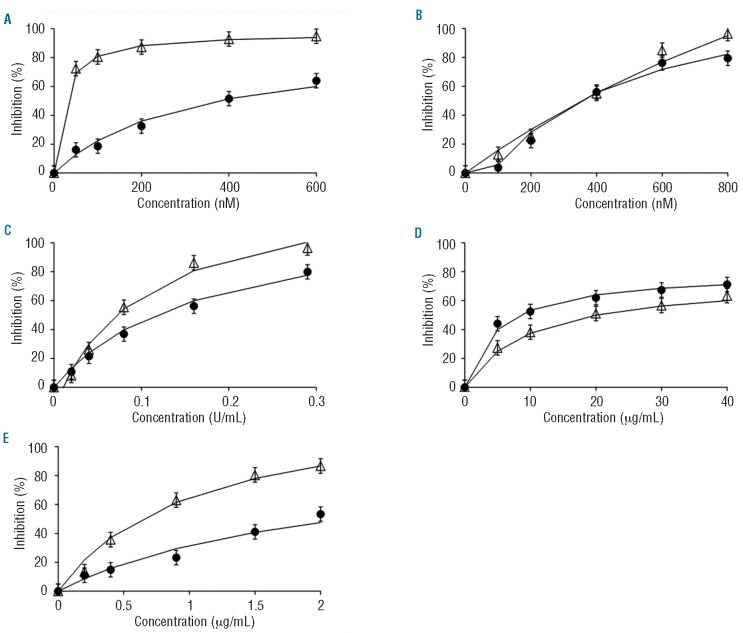
Figure 2.
Dose-response curves of ETP and peak height in normal pooled plasma. Open triangles: % inhibition of peak height; closed dots: % inhibition of endogenous thrombin potential (with 5% error bars). (A) otamixaban (B) melagatran, (C) unfractionated heparin, (D) dermatan sulfate, (E) pentasaccharide.

