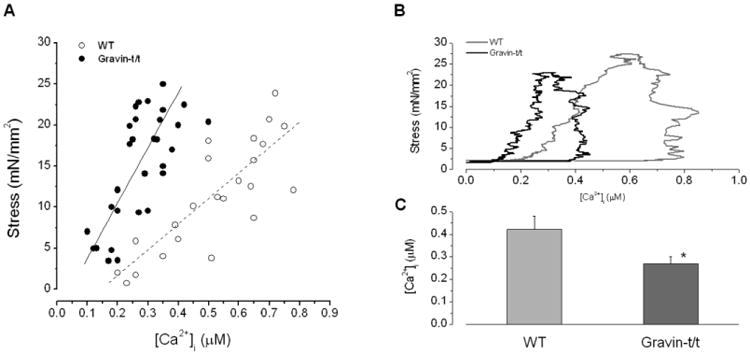
Fig. 4.

(A) Peak stress and peak [Ca2+]i transient relationships of trabecular muscles from WT and gravin-t/t mice (pooled data, n=8 in each group). In WT, force = 41 [Ca2+]i – 8.22; in gravin-t/t, force = 67 [Ca2+]i – 7.08. The relationship is also shifted leftward in gravin-t/t muscles. These two relationships are significantly different (P<0.001; MANOVA). (B) Representative phase-plane plots for stress vs. [Ca2+]i transient from WT and gravin-t/t muscles. The phase-plane plot is stress vs. [Ca2+]i transient point-to-point over the entire trajectory of the twitch. Note the phase-plane plot of gravin-t/t muscle is shifted to the left. (C) Comparison of [Ca2+]i at which stress relaxed to 50%. *P<0.05 vs. WT; n=6, [Ca2+]o = 1.0 mM.
