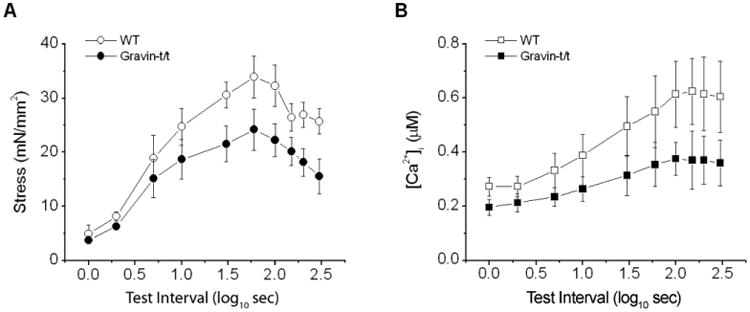
Fig. 5.

Stress-interval (A) and [Ca2+]i transient-interval (B) relations of trabecular muscles from WT and gravin-t/t mice. The test (rest) intervals are shown on logarithmic scale for the sake of clarity. At short test intervals (<5 s), stress recovered quickly, followed by a slower rise in both groups of muscles. At intervals greater than 60 s, stress started to decline. Gravin-t/t muscle also had lower stress at rest intervals greater than 10 s. [Ca2+]i transients exhibited similar pattern as test interval changed (right), with [Ca2+]i transient being lower in gravin-t/t muscles. [Ca2+]o = 1.0 mM. Note that rate of recovery of [Ca2+]i transient is similar at shorter test intervals in both groups. But the increase (or potentiation) is much slower at test intervals great than 10 s and the total increase is also lower in gravin-t/t muscles. See text for detailed discussion. [Ca2+]o = 1.0 mM.
