
Fig. 7.
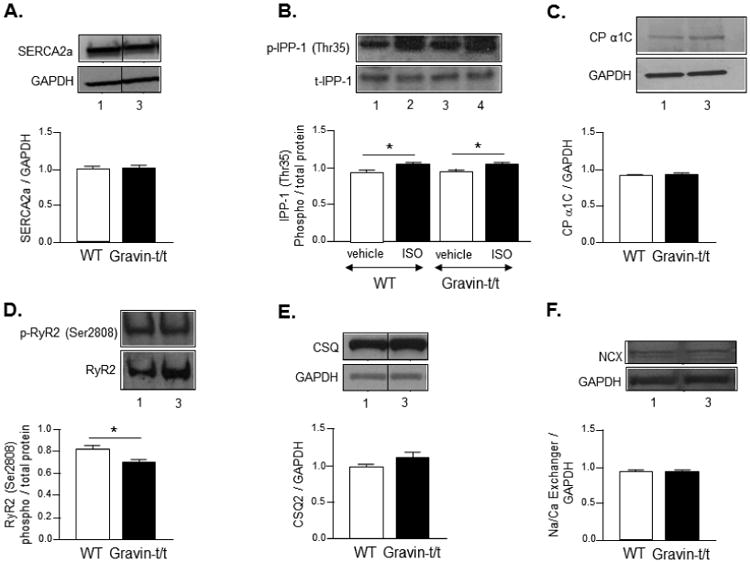
Ca2+-related protein expression. Western blot analysis of (A) sarcoplasmic reticulum Ca2+-ATPase (SERCA), (B) protein phosphatase-1 inhibitor-1 (IPP-1) following acute vehicle (ascorbic acid; 0.002%) or ISO infusion (10 μg/g/min), (C) L-type calcium channel (CP α1C), (D) ryanodine receptor (RyR2), (E) calsequestrin (CSQ2), and (F) sodium / calcium exchanger (NCX) in heart homogenates from WT and gravin-t/t mice. (Lane 1: WT (vehicle); Lane 2: WT (ISO); Lane 3: gravin-t/t (vehicle); Lane 4: gravin-t/t (ISO)). The bar graphs show the ratio of phosphorylated (phospho) to total protein or target protein to GAPDH. All lanes of a specific protein were detected on the same blot and a vertical line indicates where the blots are not contiguous. Data are expressed as the mean ± S.E.M.; n = 4 to 6 samples; *P<0.05 vs. baseline of same phenotype.