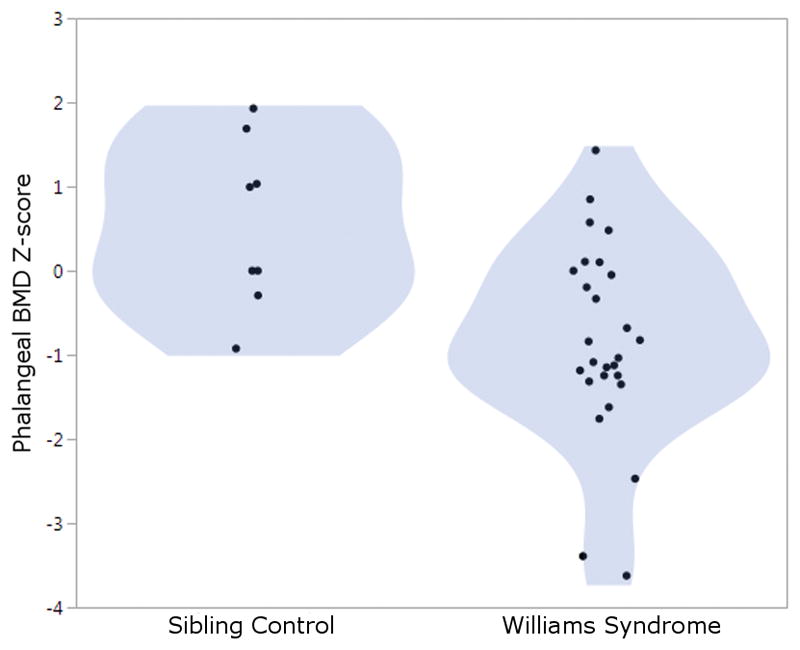
Figure 4.

Decreased Phalangeal BMD Z-score in WS Adults vs Siblings. Phalangeal BMD z-scores for individuals with Williams Syndrome compared to Sibling Controls. The shaded area represents the density of distribution. P = 0.0046 for comparison between WS and controls.
