
Figure 3. PLSDA and LASSO identify unique combinations of features that differentiate vaccine trial Ab profiles.
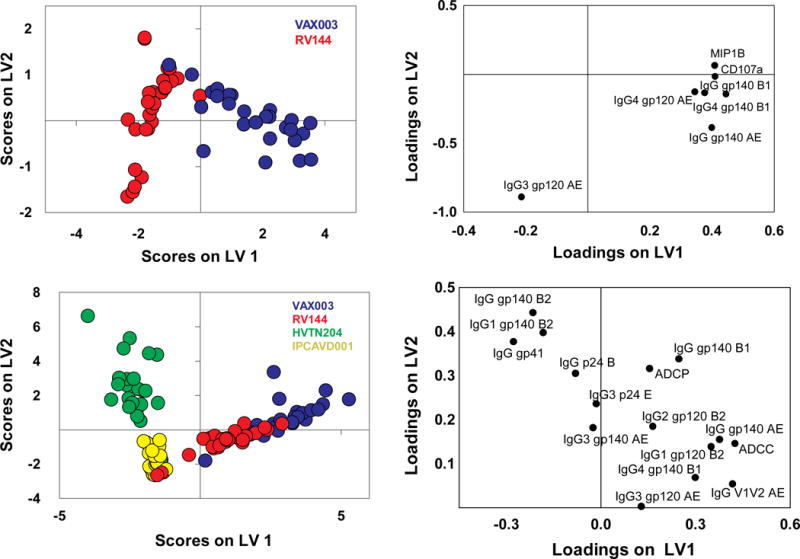
(A) The scores plot represents the RV144 (red) and VAX003 (blue) vaccine profile distribution for each vaccinee tested (dots) from the LASSO and PLSDA. Remarkably, as few as, 7 Ab features, listed on the loadings plot (B), separated the vaccine profiles with 100% calibration and 97% cross-validation accuracy. LV1 captured 61% of X variance and 72% of the Y variance. (C) LASSO and PLSDA of all 4 vaccine profiles identified 15 Ab features (D) able to discriminate between the distinct vaccine regimens (red, RV144; blue, VAX003; green, HVTN204; and yellow, IPCAVD001) with 84% cross validation accuracy. Together LV1 and LV2 captured 57% of the X variance and 45% of the Y variance, respectively. See also Tables S1 and S2.