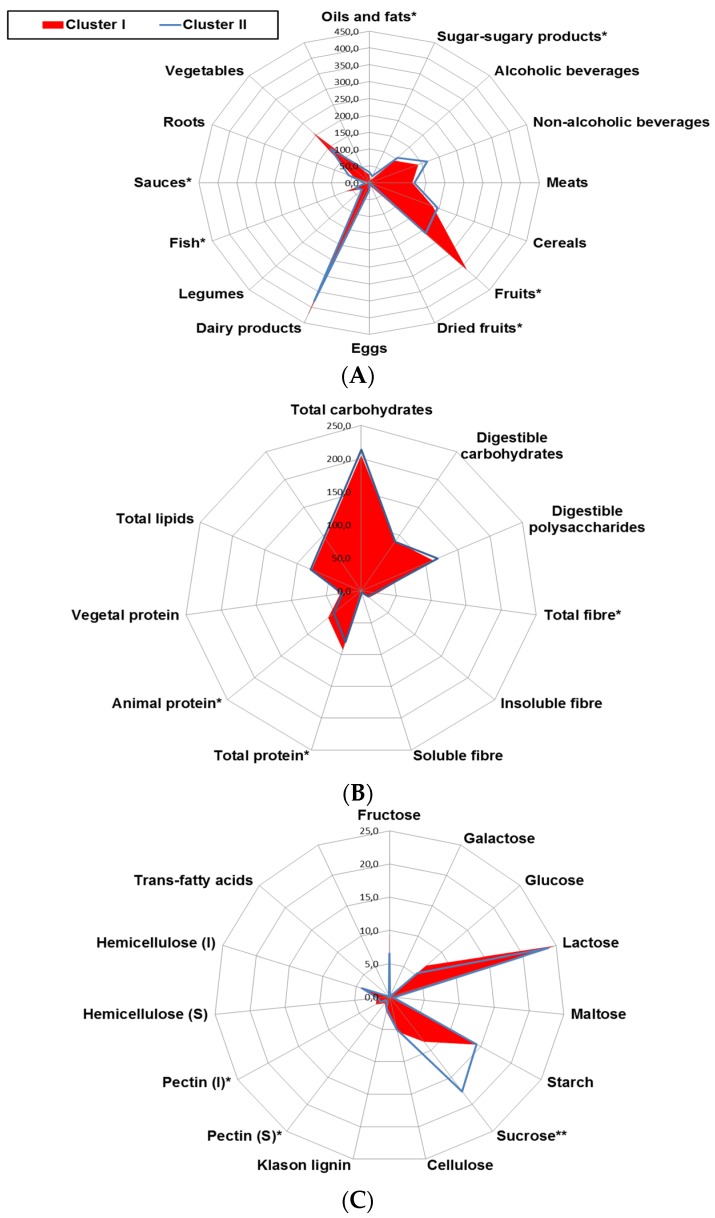
Figure 2.
Radar plot representing differences in the daily intake of (A) major food groups (g/day); (B) macronutrient and fiber (g/day) and (C) detailed carbohydrate and fibers (g/day) among clusters. Cluster I (n = 38), Cluster II (n = 26). Multivariate regression analyses were adjusted by energy intake (Kcal/day). * p ≤ 0.05.

