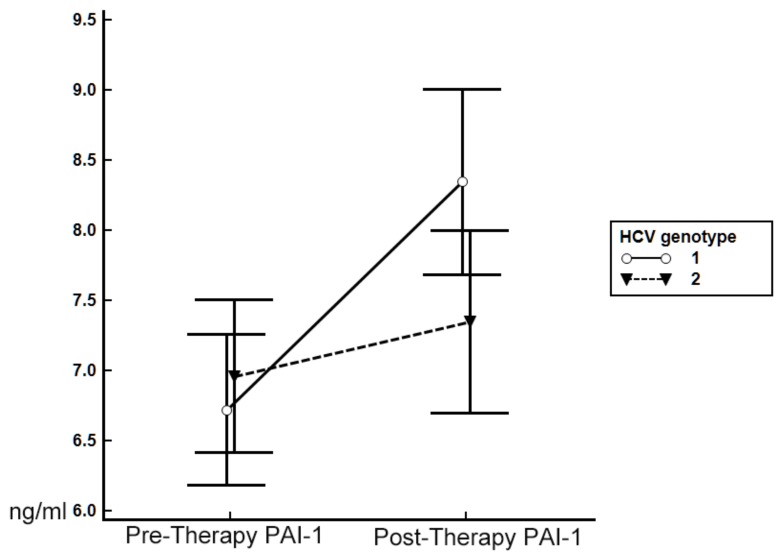
Figure 2.
Alterations in patterns of PAI-1 levels at pre- and 24-week post-anti-HCV therapy stages in patients with SVR and stratified by HCV genotype. Pre-therapy PAI-1: pre-anti-HCV therapy levels of PAI-1 (means ± standard deviations); post-therapy PAI-1: 24-week post-anti-HCV therapy PAI-1 level. Blue line: patients with genotype 1 (G1) HCV infection; red line: patients with G2 HCV infection.

